
Page 216 - [Uma_Sekaran]_Research_methods_for_business__a_sk(BookZZ.org)
P. 216
200 MEASUREMENT: SCALING, RELIABILITY, VALIDITY
side of the item as illustrated below. This gives an idea of how close or distant
the individual response to the stimulus is, as shown in the example below. Since
this does not have an absolute zero point, this is an interval scale.
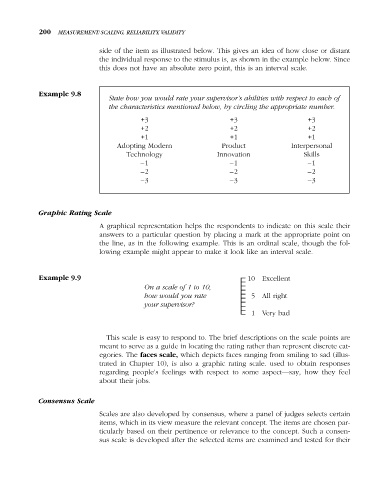
Example 9.8
State how you would rate your supervisor’s abilities with respect to each of
the characteristics mentioned below, by circling the appropriate number.
+3 +3 +3
+2 +2 +2
+1 +1 +1
Adopting Modern Product Interpersonal
Technology Innovation Skills
–1 –1 –1
–2 –2 –2
–3 –3 –3
Graphic Rating Scale
A graphical representation helps the respondents to indicate on this scale their
answers to a particular question by placing a mark at the appropriate point on
the line, as in the following example. This is an ordinal scale, though the fol-
lowing example might appear to make it look like an interval scale.
Example 9.9 – 10 Excellent
–
On a scale of 1 to 10, –
–
how would you rate – 5 All right
–
your supervisor? –
–
–
– 1 Very bad
This scale is easy to respond to. The brief descriptions on the scale points are
meant to serve as a guide in locating the rating rather than represent discrete cat-
egories. The faces scale, which depicts faces ranging from smiling to sad (illus-
trated in Chapter 10), is also a graphic rating scale. used to obtain responses
regarding people’s feelings with respect to some aspect—say, how they feel
about their jobs.
Consensus Scale
Scales are also developed by consensus, where a panel of judges selects certain
items, which in its view measure the relevant concept. The items are chosen par-
ticularly based on their pertinence or relevance to the concept. Such a consen-
sus scale is developed after the selected items are examined and tested for their