
Page 284 - [Uma_Sekaran]_Research_methods_for_business__a_sk(BookZZ.org)
P. 284
268 SAMPLING
ation of the sample (S) likely to be the same as the standard deviation of the
population (σ). However, if we choose the sample in a scientific way, we can be
–
2
reasonably sure that the sample statistic (e.g., X, S, or S ) is fairly close to the
2
population parameter (i.e., µ, σ, or σ ). To put it differently, it is possible to
choose the sample in such a way that it is representative of the population. There
is always the slight probability, however, that sample values might fall outside
the population parameters.
NORMALITY OF DISTRIBUTIONS
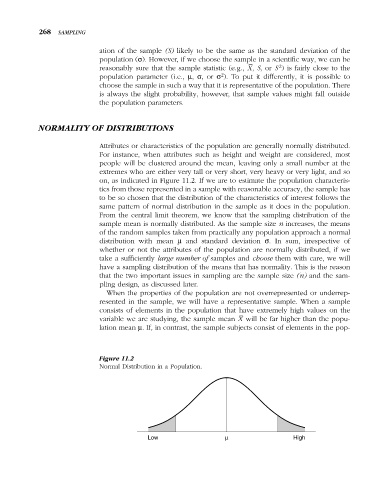
Attributes or characteristics of the population are generally normally distributed.
For instance, when attributes such as height and weight are considered, most
people will be clustered around the mean, leaving only a small number at the
extremes who are either very tall or very short, very heavy or very light, and so
on, as indicated in Figure 11.2. If we are to estimate the population characteris-
tics from those represented in a sample with reasonable accuracy, the sample has
to be so chosen that the distribution of the characteristics of interest follows the
same pattern of normal distribution in the sample as it does in the population.
From the central limit theorem, we know that the sampling distribution of the
sample mean is normally distributed. As the sample size n increases, the means
of the random samples taken from practically any population approach a normal
distribution with mean µ and standard deviation σ. In sum, irrespective of
whether or not the attributes of the population are normally distributed, if we
take a sufficiently large number of samples and choose them with care, we will
have a sampling distribution of the means that has normality. This is the reason
that the two important issues in sampling are the sample size (n) and the sam-
pling design, as discussed later.
When the properties of the population are not overrepresented or underrep-
resented in the sample, we will have a representative sample. When a sample
consists of elements in the population that have extremely high values on the
–
variable we are studying, the sample mean X will be far higher than the popu-
lation mean µ. If, in contrast, the sample subjects consist of elements in the pop-
Figure 11.2
Normal Distribution in a Population.
Low µ High