Page 354 - ACFE Fraud Reports 2009_2020
P. 354
Size of Organizations
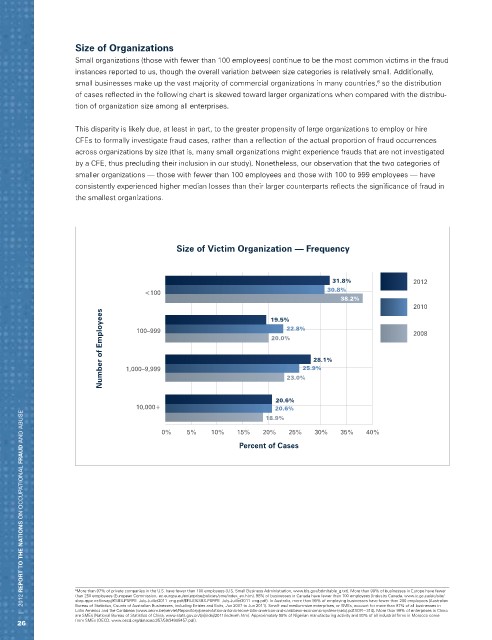
                   Small organizations (those with fewer than 100 employees) continue to be the most common victims in the fraud
                   instances reported to us, though the overall variation between size categories is relatively small. Additionally,
                   small businesses make up the vast majority of commercial organizations in many countries,  so the distribution
                                                                                             6
                   of cases reflected in the following chart is skewed toward larger organizations when compared with the distribu-
                   tion of organization size among all enterprises.

                   This disparity is likely due, at least in part, to the greater propensity of large organizations to employ or hire
                   CFEs to formally investigate fraud cases, rather than a reflection of the actual proportion of fraud occurrences
                   across organizations by size (that is, many small organizations might experience frauds that are not investigated
                   by a CFE, thus precluding their inclusion in our study). Nonetheless, our observation that the two categories of
                   smaller organizations — those with fewer than 100 employees and those with 100 to 999 employees — have
                   consistently experienced higher median losses than their larger counterparts reflects the significance of fraud in
                   the smallest organizations.


                                            Size of Victim Organization — Frequency


                                                                                  31.8%               2012
                                     <100                                        30.8%
                                                                                    38.2%
                                                                                                      2010
                          Number of Employees  1,000–9,999         20.0%   25.9%                      2008
                                                                   19.5%
                                                                       22.8%
                                  100–999

                                                                              28.1%

                                                                       23.0%


                                                                     20.6%
                                  10,000+                           20.6%
       |   2012 REPORT TO THE NATIONS on occupational FRAUD and abuse
                                                                  18.9%
                                         0%    5%    10%   15%   20%    25%   30%   35%    40%
                                                            Percent of Cases


                   6 More than 97% of private companies in the U.S. have fewer than 100 employees (U.S. Small Business Administration, www.bls.gov/bdm/table_g.txt). More than 99% of businesses in Europe have fewer
                   than 250 employees (European Commission, ec.europa.eu/enterprise/policies/sme/index_en.htm). 98% of businesses in Canada have fewer than 100 employees (Industry Canada, www.ic.gc.ca/eic/site/
                   sbrp-rppe.nsf/vwapj/KSBS-PSRPE_July-Juillet2011_eng.pdf/$FILE/KSBS-PSRPE_July-Juillet2011_eng.pdf). In Australia, more than 99% of employing businesses have fewer than 200 employees (Australian
                   Bureau of Statistics, Counts of Australian Businesses, including Entries and Exits, Jun 2007 to Jun 2011). Small- and medium-size enterprises, or SMEs, account for more than 97% of all businesses in
                   Latin America and the Caribbean (www.aecm.be/servlet/Repository/presentation-antonio-leone-latin-american-and-caribbean-economic-system-(sela).pdf?IDR=314). More than 99% of enterprises in China
                   are SMEs (National Bureau of Statistics of China, www.stats.gov.cn/tjsj/ndsj/2011/indexeh.htm). Approximately 95% of Nigerian manufacturing activity and 93% of all industrial firms in Morocco come
     26            from SMEs (OECD, www.oecd.org/dataoecd/57/59/34908457.pdf).

