Page 352 - ACFE Fraud Reports 2009_2020
P. 352

Oceanian Cases


                                    Corruption                                      40.0%        2012 (35 cases)
                                                                                    40.0%
                                      Billing                                      34.3%
                                                                           27.5%
                                                                                                 2010 (40 cases)
                                    Non-Cash                          22.9%   30.0%
                        Scheme Type  Cash on Hand      10.0%   17.1% 20.0%

                                    Skimming
                                                          12.5%
                               Check Tampering           11.4%
                                                                17.5%
                                      Payroll         8.6%
                                                 5.0%
                          Financial Statement Fraud  5.7%
                                              2.5%
                                  Cash Larceny  2.9%
                                                    7.5%
                          Expense Reimbursements  2.9%
                                                       10.0%
                           Register Disbursements  0.0%
                                               2.5%
                                          0%    5%   10%   15%  20%   25%   30%  35%   40%
                                                            Percent of Cases


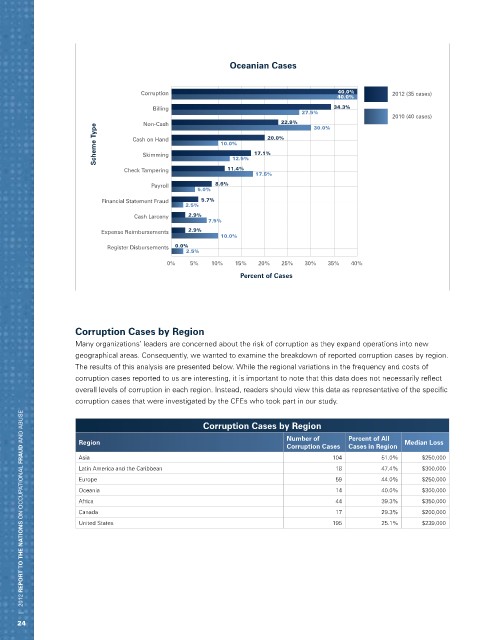
                   Corruption Cases by Region
                   Many organizations’ leaders are concerned about the risk of corruption as they expand operations into new
                   geographical areas. Consequently, we wanted to examine the breakdown of reported corruption cases by region.
                   The results of this analysis are presented below. While the regional variations in the frequency and costs of
                   corruption cases reported to us are interesting, it is important to note that this data does not necessarily reflect
                   overall levels of corruption in each region. Instead, readers should view this data as representative of the specific
                   corruption cases that were investigated by the CFEs who took part in our study.
       |   2012 REPORT TO THE NATIONS on occupational FRAUD and abuse
                                                   Corruption Cases by Region
                                                                       Number of      Percent of All
                    Region                                                                          Median Loss
                                                                       Corruption Cases  Cases in Region
                    Asia                                                           104         51.0%     $250,000
                    Latin America and the Caribbean                                18          47.4%     $300,000
                    Europe                                                         59          44.0%     $250,000
                    Oceania                                                        14          40.0%     $300,000
                    Africa                                                         44          39.3%     $350,000
                    Canada                                                         17          29.3%     $200,000
                    United States                                                  195         25.1%     $239,000


     24
   347   348   349   350   351   352   353   354   355   356   357