Page 353 - ACFE Fraud Reports 2009_2020
P. 353
Types of Organizations
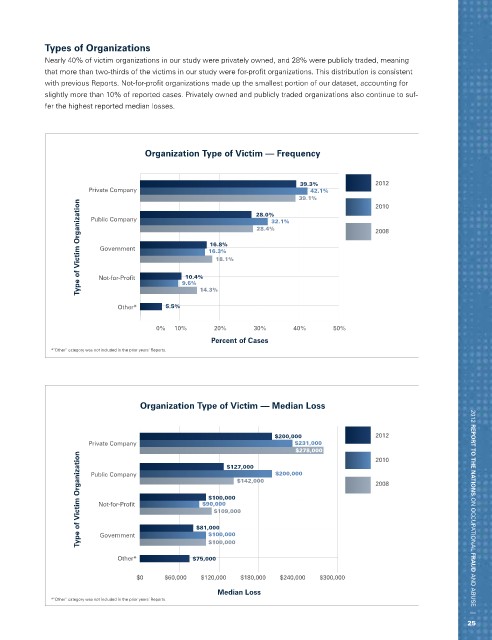
            Nearly 40% of victim organizations in our study were privately owned, and 28% were publicly traded, meaning
            that more than two-thirds of the victims in our study were for-profit organizations. This distribution is consistent
            with previous Reports. Not-for-profit organizations made up the smallest portion of our dataset, accounting for
            slightly more than 10% of reported cases. Privately owned and publicly traded organizations also continue to suf-
            fer the highest reported median losses.


                                     Organization Type of Victim — Frequency


                                                                           39.3%             2012
                       Private Company                                       42.1%
                                                                          39.1%              2010
                    Type of Victim Organization  Not-for-Profit   10.4%  16.3%  28.4%        2008
                                                                28.0%
                       Public Company
                                                                    32.1%

                                                    16.8%
                          Government
                                                      18.1%


                              Other*      5.5%  9.6%  14.3%


                                       0%   10%      20%       30%       40%       50%
                                                     Percent of Cases
              *“Other” category was not included in the prior years’ Reports.


                                   Organization Type of Victim — Median Loss


                                                                    $200,000                 2012
                       Private Company                                   $231,000
                                                                         $278,000            2010
                    Type of Victim Organization  Not-for-Profit   $81,000  $142,000          2008                    2012 REPORT TO THE NATIONS on occupational FRAUD and abuse   |
                                                         $127,000
                                                                     $200,000
                       Public Company

                                                    $100,000
                                                   $90,000
                                                     $109,000

                                                    $100,000
                         Government
                                                    $100,000
                              Other*            $75,000

                                   $0    $60,000  $120,000  $180,000  $240,000  $300,000
                                                      Median Loss
              *“Other” category was not included in the prior years’ Reports.


                                                                                                                    25

