Page 357 - ACFE Fraud Reports 2009_2020
P. 357

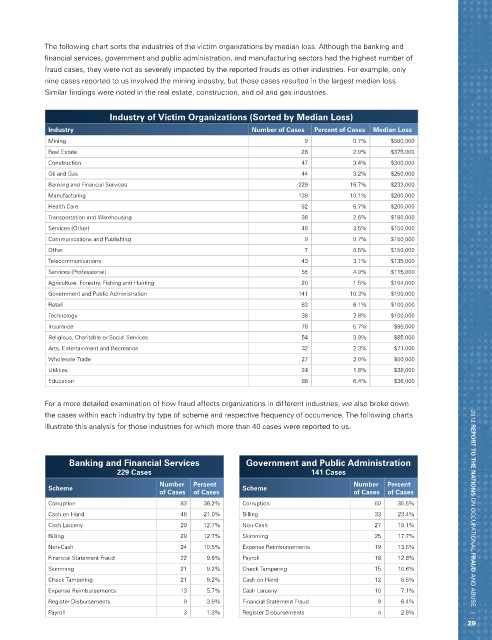
The following chart sorts the industries of the victim organizations by median loss. Although the banking and
            financial services, government and public administration, and manufacturing sectors had the highest number of
            fraud cases, they were not as severely impacted by the reported frauds as other industries. For example, only
            nine cases reported to us involved the mining industry, but those cases resulted in the largest median loss.
            Similar findings were noted in the real estate, construction, and oil and gas industries.


                            Industry of Victim Organizations (Sorted by Median Loss)
             Industry                                          Number of Cases  Percent of Cases  Median Loss
             Mining                                                         9           0.7%     $500,000
             Real Estate                                                   28           2.0%     $375,000
             Construction                                                  47           3.4%     $300,000
             Oil and Gas                                                   44           3.2%     $250,000
             Banking and Financial Services                               229          16.7%     $232,000
             Manufacturing                                                139          10.1%     $200,000
             Health Care                                                   92           6.7%     $200,000
             Transportation and Warehousing                                36           2.6%     $180,000
             Services (Other)                                              48           3.5%     $150,000
             Communications and Publishing                                  9           0.7%     $150,000
             Other                                                          7           0.5%     $150,000
             Telecommunications                                            43           3.1%     $135,000
             Services (Professional)                                       55           4.0%     $115,000
             Agriculture, Forestry, Fishing and Hunting                    20           1.5%     $104,000
             Government and Public Administration                         141          10.3%     $100,000
             Retail                                                        83           6.1%     $100,000
             Technology                                                    38           2.8%     $100,000
             Insurance                                                     78           5.7%      $95,000
             Religious, Charitable or Social Services                      54           3.9%      $85,000
             Arts, Entertainment and Recreation                            32           2.3%      $71,000
             Wholesale Trade                                               27           2.0%      $50,000
             Utilities                                                     24           1.8%      $38,000
             Education                                                     88           6.4%      $36,000

            For a more detailed examination of how fraud affects organizations in different industries, we also broke down
            the cases within each industry by type of scheme and respective frequency of occurrence. The following charts
            illustrate this analysis for those industries for which more than 40 cases were reported to us.


                  Banking and Financial Services             Government and Public Administration
                              229 Cases                                      141 Cases
                                        Number   Percent                                Number   Percent
             Scheme                                         Scheme
                                        of Cases  of Cases                              of Cases  of Cases
             Corruption                      83    36.2%    Corruption                       50    35.5%
             Cash on Hand                    48    21.0%    Billing                          33    23.4%             2012 REPORT TO THE NATIONS on occupational FRAUD and abuse   |
             Cash Larceny                    29    12.7%    Non-Cash                         27    19.1%
             Billing                         29    12.7%    Skimming                         25    17.7%
             Non-Cash                        24    10.5%    Expense Reimbursements           19    13.5%
             Financial Statement Fraud       22     9.6%    Payroll                          18    12.8%
             Skimming                        21     9.2%    Check Tampering                  15    10.6%
             Check Tampering                 21     9.2%    Cash on Hand                     12    8.5%
             Expense Reimbursements          13     5.7%    Cash Larceny                     10    7.1%
             Register Disbursements           9     3.9%    Financial Statement Fraud         9    6.4%
             Payroll                          3     1.3%    Register Disbursements            4    2.8%
                                                                                                                    29
   352   353   354   355   356   357   358   359   360   361   362