Page 360 - ACFE Fraud Reports 2009_2020
P. 360
Corruption Cases by Industry
                   Certain industries are often considered to be particularly susceptible to bribery and other forms of corruption.
                   Consequently, we found it informative to provide an industry-to-industry comparison of the rates at which corrup-
                   tion occurred in the cases reported to us.


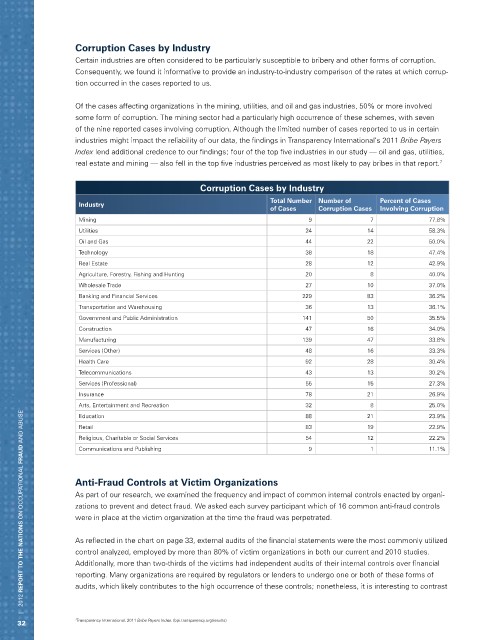
                   Of the cases affecting organizations in the mining, utilities, and oil and gas industries, 50% or more involved
                   some form of corruption. The mining sector had a particularly high occurrence of these schemes, with seven
                   of the nine reported cases involving corruption. Although the limited number of cases reported to us in certain
                   industries might impact the reliability of our data, the findings in Transparency International’s 2011 Bribe Payers
                   Index lend additional credence to our findings; four of the top five industries in our study — oil and gas, utilities,
                   real estate and mining — also fell in the top five industries perceived as most likely to pay bribes in that report. 7


                                                  Corruption Cases by Industry
                                                                   Total Number  Number of    Percent of Cases
                    Industry
                                                                   of Cases    Corruption Cases  Involving Corruption
                    Mining                                                   9              7             77.8%
                    Utilities                                               24             14             58.3%
                    Oil and Gas                                             44             22             50.0%
                    Technology                                              38             18             47.4%
                    Real Estate                                             28             12             42.9%
                    Agriculture, Forestry, Fishing and Hunting              20              8             40.0%
                    Wholesale Trade                                         27             10             37.0%
                    Banking and Financial Services                         229             83             36.2%
                    Transportation and Warehousing                          36             13             36.1%
                    Government and Public Administration                   141             50             35.5%
                    Construction                                            47             16             34.0%
                    Manufacturing                                          139             47             33.8%
                    Services (Other)                                        48             16             33.3%
                    Health Care                                             92             28             30.4%
                    Telecommunications                                      43             13             30.2%
                    Services (Professional)                                 55             15             27.3%
                    Insurance                                               78             21             26.9%
                    Arts, Entertainment and Recreation                      32              8             25.0%
       |   2012 REPORT TO THE NATIONS on occupational FRAUD and abuse
                    Education                                               88             21             23.9%
                    Retail                                                  83             19             22.9%
                    Religious, Charitable or Social Services                54             12             22.2%
                    Communications and Publishing                            9              1             11.1%


                   Anti-Fraud Controls at Victim Organizations
                   As part of our research, we examined the frequency and impact of common internal controls enacted by organi-
                   zations to prevent and detect fraud. We asked each survey participant which of 16 common anti-fraud controls
                   were in place at the victim organization at the time the fraud was perpetrated.


                   As reflected in the chart on page 33, external audits of the financial statements were the most commonly utilized
                   control analyzed, employed by more than 80% of victim organizations in both our current and 2010 studies.
                   Additionally, more than two-thirds of the victims had independent audits of their internal controls over financial
                   reporting. Many organizations are required by regulators or lenders to undergo one or both of these forms of
                   audits, which likely contributes to the high occurrence of these controls; nonetheless, it is interesting to contrast


     32            7 Transparency International, 2011 Bribe Payers Index. (bpi.transparency.org/results)

