Page 348 - ACFE Fraud Reports 2009_2020
P. 348
Victim Organizations


                   Geographical Location
                   of Organizations
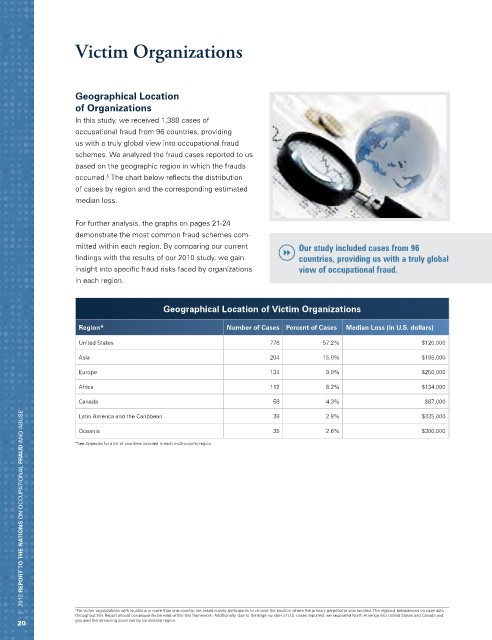
                   In this study, we received 1,388 cases of
                   occupational fraud from 96 countries, providing
                   us with a truly global view into occupational fraud
                   schemes. We analyzed the fraud cases reported to us
                   based on the geographic region in which the frauds
                   occurred.  The chart below reflects the distribution
                           5
                   of cases by region and the corresponding estimated
                   median loss.


                   For further analysis, the graphs on pages 21-24
                   demonstrate the most common fraud schemes com-
                   mitted within each region. By comparing our current    Our study included cases from 96
                   findings with the results of our 2010 study, we gain   countries, providing us with a truly global
                   insight into specific fraud risks faced by organizations   view of occupational fraud.
                   in each region.


                                         Geographical Location of Victim Organizations


                    Region*                              Number of Cases  Percent of Cases  Median Loss (in U.S. dollars)
                    United States                                  778          57.2%                   $120,000
                    Asia                                           204          15.0%                    $195,000
                    Europe                                         134           9.9%                    $250,000

                    Africa                                         112           8.2%                    $134,000
                    Canada                                          58           4.3%                     $87,000
       |   2012 REPORT TO THE NATIONS on occupational FRAUD and abuse
                    Latin America and the Caribbean                 38           2.8%                    $325,000
                    Oceania                                         35           2.6%                    $300,000
                   *See Appendix for a list of countries included in each multi-country region.


                   5 For victim organizations with locations in more than one country, we asked survey participants to choose the location where the primary perpetrator was located. The regional breakdowns on case data
                   throughout this Report should consequently be read within this framework. Additionally, due to the large number of U.S. cases reported, we separated North America into United States and Canada and
     20            grouped the remaining countries by continental region.

