Page 380 - ACFE Fraud Reports 2009_2020
P. 380
Department of Perpetrator — Frequency


                                          Accounting                                     22.0%        2012
                                                                                         22.0%
                                          Operations                             17.4%
                                                                                  18.0%
                                                                                                      2010
                                             Sales                      12.8%
                                                                          13.5%
                              Executive/Upper Management               11.9%
                                                                          13.5%
                                      Customer Service        6.9%
                                                              7.2%
                                            Other*          5.9%
                                          Purchasing        5.7%
                                                             6.2%
                                  Warehousing/Inventory  4.2%
                                                          4.7%
                           Department  Information Technology  2.0% 3.7%
                                            Finance
                                                         4.2%
                                                       2.8%
                              Manufacturing and Production  1.9%
                                                     1.7%
                                     Board of Directors  1.4%
                                                    1.4%
                                     Human Resources  1.2%
                                                    1.3%
                                Marketing/Public Relations  1.1%
                                                     2.0%
                                Research and Development  0.7%
                                                   0.8%
                                             Legal  0.6%
                                                   0.5%
                                                   0.6%
                                        Internal Audit
                                                  0.2%
                                                 0%      5%       15%      10%     20%      25%
                                                                 Percent of Cases
                     *“Other” category was not included in the 2010 Report.


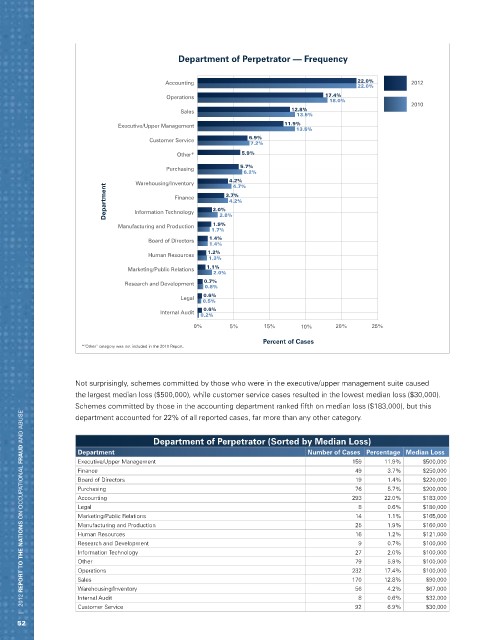
                   Not surprisingly, schemes committed by those who were in the executive/upper management suite caused
                   the largest median loss ($500,000), while customer service cases resulted in the lowest median loss ($30,000).
                   Schemes committed by those in the accounting department ranked fifth on median loss ($183,000), but this
       |   2012 REPORT TO THE NATIONS on occupational FRAUD and abuse
                   department accounted for 22% of all reported cases, far more than any other category.

                                       Department of Perpetrator (Sorted by Median Loss)
                    Department                                              Number of Cases Percentage Median Loss
                    Executive/Upper Management                                         159     11.9%     $500,000
                    Finance                                                             49      3.7%     $250,000
                    Board of Directors                                                  19      1.4%     $220,000
                    Purchasing                                                          76      5.7%     $200,000
                    Accounting                                                         293     22.0%     $183,000
                    Legal                                                                8      0.6%     $180,000
                    Marketing/Public Relations                                          14      1.1%     $165,000
                    Manufacturing and Production                                        25      1.9%     $160,000
                    Human Resources                                                     16      1.2%     $121,000
                    Research and Development                                             9      0.7%     $100,000
                    Information Technology                                              27      2.0%     $100,000
                    Other                                                               79      5.9%     $100,000
                    Operations                                                         232     17.4%     $100,000
                    Sales                                                              170     12.8%     $90,000
                    Warehousing/Inventory                                               56      4.2%     $67,000
                    Internal Audit                                                       8      0.6%     $32,000
                    Customer Service                                                    92      6.9%     $30,000

     52

