Page 378 - ACFE Fraud Reports 2009_2020
P. 378

Tenure of Perpetrator — Median Loss

                               $350000                                                 $289,000        2012

                               $300000                                      $261,000      $250,000

                               $250000                                 $200,000  $231,000  $229,000    2010
                           Median Loss  $200000         $100,000  $114,000  $142,000                   2008


                               $150000

                               $100000       $47,000  $50,000
                                          $25,000
                               $50000
                                   $0
                                       Less than 1 year  1 to 5 years  6 to 10 years  More than 10 years

                                                     Tenure of Perpetrator


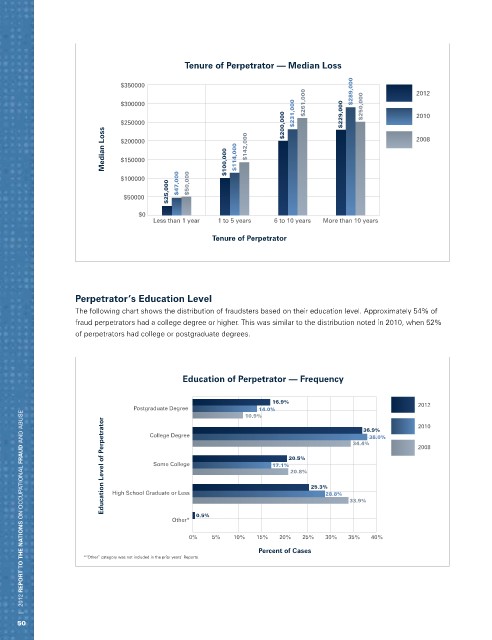
                   Perpetrator’s Education Level
                   The following chart shows the distribution of fraudsters based on their education level. Approximately 54% of
                   fraud perpetrators had a college degree or higher. This was similar to the distribution noted in 2010, when 52%
                   of perpetrators had college or postgraduate degrees.


                                              Education of Perpetrator — Frequency


                                                                    16.9%
                                  Postgraduate Degree           14.0%                                  2012
       |   2012 REPORT TO THE NATIONS on occupational FRAUD and abuse
                                                             10.9%                        36.9%        2010
                          Education Level of Perpetrator  High School Graduate or Less  17.1% 20.5%  25.3%  34.4%  2008
                                      College Degree
                                                                                           38.0%

                                       Some College
                                                                        20.8%


                                           Other*  0.5%                          28.8%  33.9%

                                               0%    5%   10%   15%  20%   25%   30%  35%   40%
                                                                Percent of Cases
                      *“Other” category was not included in the prior years’ Reports.


     50
   373   374   375   376   377   378   379   380   381   382   383