Page 379 - ACFE Fraud Reports 2009_2020
P. 379
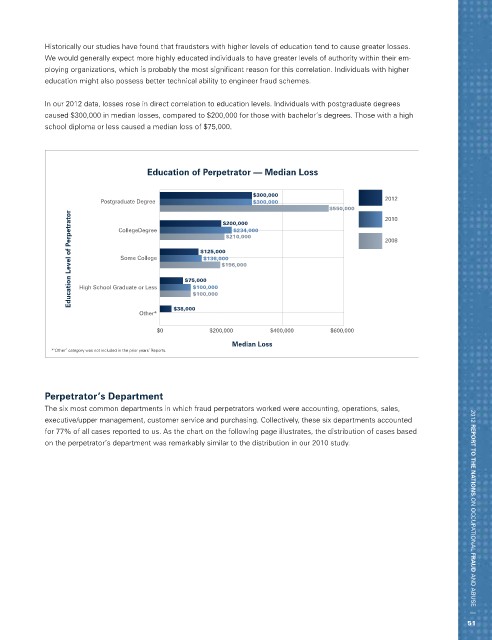
Historically our studies have found that fraudsters with higher levels of education tend to cause greater losses.
            We would generally expect more highly educated individuals to have greater levels of authority within their em-
            ploying organizations, which is probably the most significant reason for this correlation. Individuals with higher
            education might also possess better technical ability to engineer fraud schemes.

            In our 2012 data, losses rose in direct correlation to education levels. Individuals with postgraduate degrees
            caused $300,000 in median losses, compared to $200,000 for those with bachelor’s degrees. Those with a high
            school diploma or less caused a median loss of $75,000.


                                     Education of Perpetrator — Median Loss

                                                               $300,000
                          Postgraduate Degree                  $300,000                        2012
                                                                                  $550,000     2010
                  Education Level of Perpetrator  Some College  $75,000 $136,000 $210,000      2008
                                                        $200,000
                              CollegeDegree
                                                          $234,000
                                                  $125,000
                                                       $196,000

                    High School Graduate or Less
                                                $100,000

                                   Other*   $38,000 $100,000

                                       $0           $200,000       $400,000       $600,000
                                                          Median Loss
              *“Other” category was not included in the prior years’ Reports.


            Perpetrator’s Department
            The six most common departments in which fraud perpetrators worked were accounting, operations, sales,
            executive/upper management, customer service and purchasing. Collectively, these six departments accounted
            for 77% of all cases reported to us. As the chart on the following page illustrates, the distribution of cases based
            on the perpetrator’s department was remarkably similar to the distribution in our 2010 study.            2012 REPORT TO THE NATIONS on occupational FRAUD and abuse   |


                                                                                                                    51

