Page 381 - ACFE Fraud Reports 2009_2020
P. 381

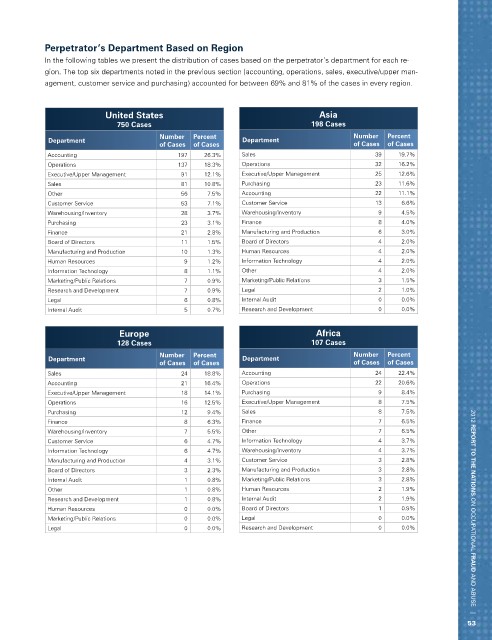
Perpetrator’s Department Based on Region
            In the following tables we present the distribution of cases based on the perpetrator’s department for each re-
            gion. The top six departments noted in the previous section (accounting, operations, sales, executive/upper man-
            agement, customer service and purchasing) accounted for between 69% and 81% of the cases in every region.


                           United States                                       Asia
                              750 Cases                                      198 Cases
                                        Number   Percent                                Number   Percent
             Department                                     Department
                                        of Cases  of Cases                              of Cases  of Cases
             Accounting                      197   26.3%    Sales                            39    19.7%
             Operations                      137   18.3%    Operations                       32    16.2%
             Executive/Upper Management      91    12.1%    Executive/Upper Management       25    12.6%
             Sales                           81    10.8%    Purchasing                       23    11.6%
             Other                           56     7.5%    Accounting                       22    11.1%
             Customer Service                53     7.1%    Customer Service                 13    6.6%
             Warehousing/Inventory           28     3.7%    Warehousing/Inventory             9    4.5%
             Purchasing                      23     3.1%    Finance                           8    4.0%
             Finance                         21     2.8%    Manufacturing and Production      6    3.0%
             Board of Directors              11     1.5%    Board of Directors                4    2.0%
             Manufacturing and Production    10     1.3%    Human Resources                   4    2.0%
             Human Resources                  9     1.2%    Information Technology            4    2.0%
             Information Technology           8     1.1%    Other                             4    2.0%
             Marketing/Public Relations       7     0.9%    Marketing/Public Relations        3    1.5%
             Research and Development         7     0.9%    Legal                             2    1.0%
             Legal                            6     0.8%    Internal Audit                    0    0.0%
             Internal Audit                   5     0.7%    Research and Development          0    0.0%

                              Europe                                           Africa
                              128 Cases                                      107 Cases
                                        Number   Percent                                Number   Percent
             Department                                     Department
                                        of Cases  of Cases                              of Cases  of Cases
             Sales                           24    18.8%    Accounting                       24    22.4%
             Accounting                      21    16.4%    Operations                       22    20.6%
             Executive/Upper Management      18    14.1%    Purchasing                        9    8.4%
             Operations                      16    12.5%    Executive/Upper Management        8    7.5%
             Purchasing                      12     9.4%    Sales                             8    7.5%
             Finance                          8     6.3%    Finance                           7    6.5%
             Warehousing/Inventory            7     5.5%    Other                             7    6.5%
             Customer Service                 6     4.7%    Information Technology            4    3.7%
             Information Technology           6     4.7%    Warehousing/Inventory             4    3.7%
             Manufacturing and Production     4     3.1%    Customer Service                  3    2.8%
             Board of Directors               3     2.3%    Manufacturing and Production      3    2.8%
             Internal Audit                   1     0.8%    Marketing/Public Relations        3    2.8%
             Other                            1     0.8%    Human Resources                   2    1.9%
             Research and Development         1     0.8%    Internal Audit                    2    1.9%
             Human Resources                  0     0.0%    Board of Directors                1    0.9%              2012 REPORT TO THE NATIONS on occupational FRAUD and abuse   |
             Marketing/Public Relations       0     0.0%    Legal                             0    0.0%
             Legal                            0     0.0%    Research and Development          0    0.0%


                                                                                                                    53
   376   377   378   379   380   381   382   383   384   385   386