Page 446 - ACFE Fraud Reports 2009_2020
P. 446
Position of Perpetrator Based on Region
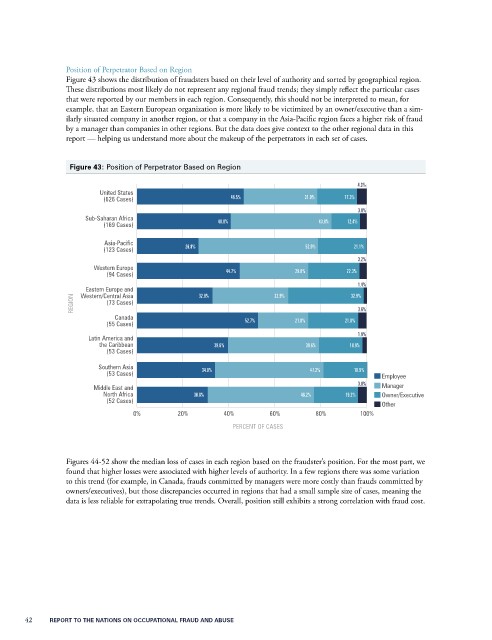
                 Figure 43 shows the distribution of fraudsters based on their level of authority and sorted by geographical region.
                 These distributions most likely do not represent any regional fraud trends; they simply reflect the particular cases
                 that were reported by our members in each region. Consequently, this should not be interpreted to mean, for
                 example, that an Eastern European organization is more likely to be victimized by an owner/executive than a sim-
                 ilarly situated company in another region, or that a company in the Asia-Pacific region faces a higher risk of fraud
                 by a manager than companies in other regions. But the data does give context to the other regional data in this
                 report — helping us understand more about the makeup of the perpetrators in each set of cases.


                  Figure 43: Position of Perpetrator Based on Region

                                                                                         4.3%
                          United States
                          (626 Cases)                     46.5%             31.9%    17.3%
                                                                                         3.0%
                      Sub-Saharan Africa              40.8%                    43.8%  12.4%
                          (169 Cases)
                           Asia-Pacific
                          (123 Cases)         26.8%                         52.0%       21.1%
                                                                                         3.2%
                        Western Europe                  44.7%            29.8%        22.3%
                           (94 Cases)
                                                                                         1.4%
                      Eastern Europe and          32.9%             32.9%              32.9%
                     Western/Central Asia
                   REGION  (73 Cases)                                                    3.6%
                             Canada
                           (55 Cases)                        52.7%       21.8%        21.8%
                                                                                         1.9%
                       Latin America and
                         the Caribbean                39.6%                 39.6%      18.9%
                           (53 Cases)
                         Southern Asia             34.0%                     47.2%      18.9%
                           (53 Cases)                                                          Employee
                                                                                         3.8%
                        Middle East and                                                        Manager
                          North Africa           30.8%                     46.2%      19.2%    Owner/Executive
                           (52 Cases)
                                                                                               Other
                                  0%         20%        40%        60%        80%        100%
                                                          PERCENT OF CASES


                 Figures 44-52 show the median loss of cases in each region based on the fraudster’s position. For the most part, we
                 found that higher losses were associated with higher levels of authority. In a few regions there was some variation
                 to this trend (for example, in Canada, frauds committed by managers were more costly than frauds committed by
                 owners/executives), but those discrepancies occurred in regions that had a small sample size of cases, meaning the
                 data is less reliable for extrapolating true trends. Overall, position still exhibits a strong correlation with fraud cost.


       42           REPORT TO THE NATIONS ON OCCUPATIONAL FRAUD AND ABUSE

