Page 546 - ACFE Fraud Reports 2009_2020
P. 546
Perpetrators


                 The Impact of Collusion
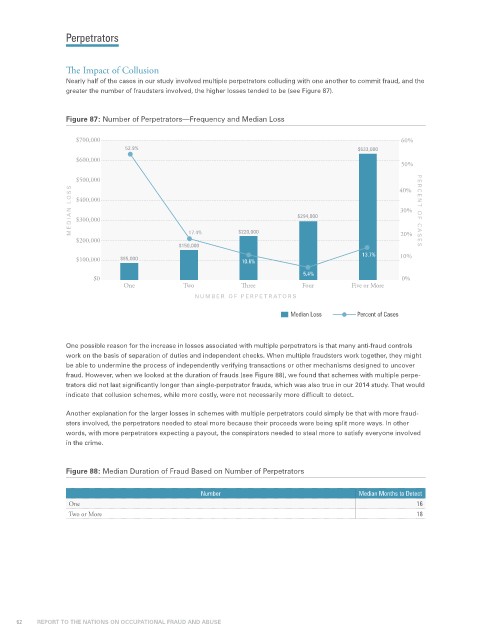
                 Nearly half of the cases in our study involved multiple perpetrators colluding with one another to commit fraud, and the
                 greater the number of fraudsters involved, the higher losses tended to be (see Figure 87).


                 Figure 87: Number of Perpetrators—Frequency and Median Loss

                    $700,000                                                                       60%
                                52.9%                                                    $633,000
                    $600,000
                                                                                                   50%
                    $500,000                                                                       40%
                  MEDIAN L OSS  $400,000                                  $294,000                 30%  PERCENT OF CASES


                    $300,000

                    $200,000                   17.4%       $220,000                                20%
                                             $150,000
                                                                                          13.7%    10%
                    $100,000   $85,000                      10.6%
                                                                           5.4%
                        $0                                                                         0%
                               One            Two            ree           Four        Five or More
                                                 NUMBER OF PERPETRATORS

                                                                        Median Loss      Percent of Cases


                 One possible reason for the increase in losses associated with multiple perpetrators is that many anti-fraud controls
                 work on the basis of separation of duties and independent checks. When multiple fraudsters work together, they might
                 be able to undermine the process of independently verifying transactions or other mechanisms designed to uncover
                 fraud. However, when we looked at the duration of frauds (see Figure 88), we found that schemes with multiple perpe-
                 trators did not last significantly longer than single-perpetrator frauds, which was also true in our 2014 study. That would
                 indicate that collusion schemes, while more costly, were not necessarily more difficult to detect.

                 Another explanation for the larger losses in schemes with multiple perpetrators could simply be that with more fraud-
                 sters involved, the perpetrators needed to steal more because their proceeds were being split more ways. In other
                 words, with more perpetrators expecting a payout, the conspirators needed to steal more to satisfy everyone involved
                 in the crime.


                 Figure 88: Median Duration of Fraud Based on Number of Perpetrators


                                                  Number                                 Median Months to Detect
                  One                                                                                  16
                  Two or More                                                                          18


     62           REPORT TO THE NATIONS ON OCCUPATIONAL FRAUD AND ABUSE

