Page 542 - ACFE Fraud Reports 2009_2020
P. 542
Perpetrators


                 Median Loss Based on Gender
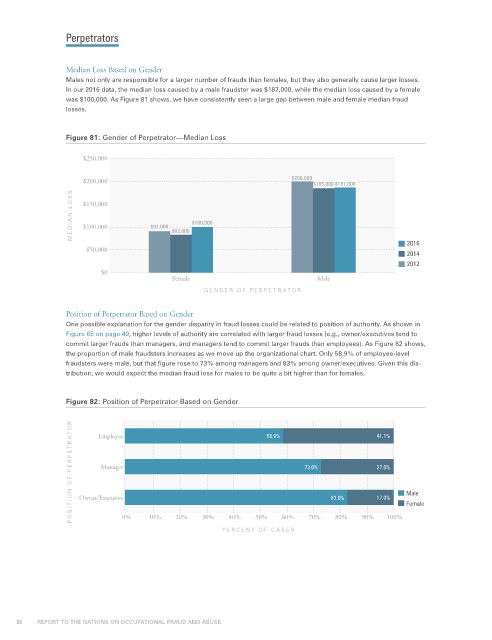
                 Males not only are responsible for a larger number of frauds than females, but they also generally cause larger losses.
                 In our 2016 data, the median loss caused by a male fraudster was $187,000, while the median loss caused by a female
                 was $100,000. As Figure 81 shows, we have consistently seen a large gap between male and female median fraud
                 losses.


                 Figure 81: Gender of Perpetrator—Median Loss


                     $250,000

                     $200,000                                           $200,000 $185,000 $187,000
                   MEDIAN L OSS  $150,000  $91,000  $100,000


                     $100,000
                                           $83,000
                                                                                                     2016
                      $50,000
                                                                                                     2014
                                                                                                     2012
                          $0
                                           Female                              Male
                                                   GENDER OF PERPETRATOR

                 Position of Perpetrator Based on Gender
                 One possible explanation for the gender disparity in fraud losses could be related to position of authority. As shown in
                 Figure 65 on page 49, higher levels of authority are correlated with larger fraud losses (e.g., owner/executives tend to
                 commit larger frauds than managers, and managers tend to commit larger frauds than employees). As Figure 82 shows,
                 the proportion of male fraudsters increases as we move up the organizational chart. Only 58.9% of employee-level
                 fraudsters were male, but that figure rose to 73% among managers and 83% among owner/executives. Given this dis-
                 tribution, we would expect the median fraud loss for males to be quite a bit higher than for females.


                 Figure 82: Position of Perpetrator Based on Gender  58.9%                   41.1%

                   POSITION OF PERPETRATOR  Owner/Executive                 73.0%  83.0%     27.0%   Male
                         Employee


                          Manager


                                                                                             17.0%
                                                                50%
                                                                      60%
                               0%
                                                   30%
                                            20%
                                     10%
                                                         40%
                                                        PERCENT OF CASES     70%   80%    90%   100%  Female


     58           REPORT TO THE NATIONS ON OCCUPATIONAL FRAUD AND ABUSE

