Page 543 - ACFE Fraud Reports 2009_2020
P. 543
Perpetrators


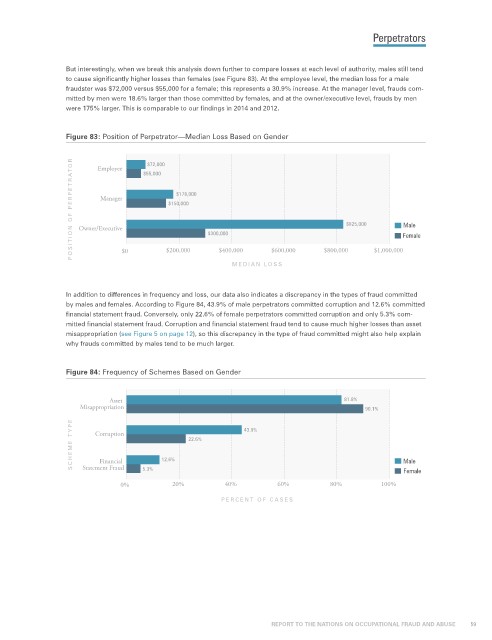
                 But interestingly, when we break this analysis down further to compare losses at each level of authority, males still tend
                 to cause significantly higher losses than females (see Figure 83). At the employee level, the median loss for a male
                 fraudster was $72,000 versus $55,000 for a female; this represents a 30.9% increase. At the manager level, frauds com-
                 mitted by men were 18.6% larger than those committed by females, and at the owner/executive level, frauds by men
                 were 175% larger. This is comparable to our findings in 2014 and 2012.


                 Figure 83: Position of Perpetrator—Median Loss Based on Gender


                   POSITION OF PERPETRATOR  Owner/Executive  $150,000  $300,000       $825,000      Male
                                     $72,000
                         Employee
                                    $55,000
                                            $178,000
                          Manager


                                                                                                    Female

                                                                    $600,000
                                          $200,000
                                                       $400,000
                               $0
                                                          MEDIAN L OSS          $800,000     $1,000,000
                 In addition to differences in frequency and loss, our data also indicates a discrepancy in the types of fraud committed
                 by males and females. According to Figure 84, 43.9% of male perpetrators committed corruption and 12.6% committed
                 financial statement fraud. Conversely, only 22.6% of female perpetrators committed corruption and only 5.3% com-
                 mitted financial statement fraud. Corruption and financial statement fraud tend to cause much higher losses than asset
                 misappropriation (see Figure 5 on page 12), so this discrepancy in the type of fraud committed might also help explain
                 why frauds committed by males tend to be much larger.


                 Figure 84: Frequency of Schemes Based on Gender


                            Asset                                                    81.8%
                     Misappropriation                                                      90.1%
                   SCHEME TYPE  Corruption  12.6%  22.6%     43.9%                                  Male


                         Financial
                     Statement Fraud

                               0%   5.3%   20%          40%          60%          80%         100%  Female
                                                       PERCENT OF CASES


                                                                    REPORT TO THE NATIONS ON OCCUPATIONAL FRAUD AND ABUSE           59

