Page 539 - ACFE Fraud Reports 2009_2020
P. 539
Perpetrators


                 Perpetrator’s Department
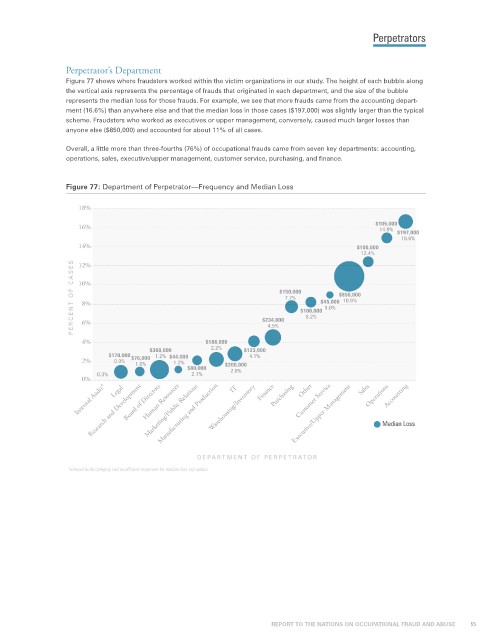
                 Figure 77 shows where fraudsters worked within the victim organizations in our study. The height of each bubble along
                 the vertical axis represents the percentage of frauds that originated in each department, and the size of the bubble
                 represents the median loss for those frauds. For example, we see that more frauds came from the accounting depart-
                 ment (16.6%) than anywhere else and that the median loss in those cases ($197,000) was slightly larger than the typical
                 scheme. Fraudsters who worked as executives or upper management, conversely, caused much larger losses than
                 anyone else ($850,000) and accounted for about 11% of all cases.

                 Overall, a little more than three-fourths (76%) of occupational frauds came from seven key departments: accounting,
                 operations, sales, executive/upper management, customer service, purchasing, and finance.


                 Figure 77: Department of Perpetrator—Frequency and Median Loss

                    18%

                    16%                                                                      $105,000
                                                                                              14.9%
                                                                                                  $197,000
                                                                                                   16.6%
                    14%                                                                 $100,000
                                                                                         12.4%
                    12%
                   PERCENT OF CASES  10%                         $234,000 7.7%  $100,000 $45,000 10.9%

                                                                     $150,000
                                                                                    $850,000
                     8%
                                                                                 9.0%
                                                                            8.2%
                     6%

                     4%                            $188,000        4.5%
                                      $360,000       2.2%    $123,000
                            $170,000   1.2% $44,000           4.1%
                     2%      0.9%  $76,000  1.2%
                                  1.0%
                                               $80,000  $200,000
                                                         2.8%
                         0.3%                   2.1%
                     0%                                   IT
                                                                                                Accounting
                                     Marketing/Public Relations
                                     Human Resources
                       Research and Development
                                                                          Customer Service
                                                                           Other
                    Internal Audit*  Legal Board of Directors Manufacturing and Production Warehousing/Inventory  Finance Purchasing Executive/Upper Management  Sales Operations Median Loss
                                                 DEPARTMENT OF PERPETRATOR
                  *Internal Audit category had insufficient responses for median loss calculation.


                                                                    REPORT TO THE NATIONS ON OCCUPATIONAL FRAUD AND ABUSE           55

