Page 535 - ACFE Fraud Reports 2009_2020
P. 535

Perpetrators


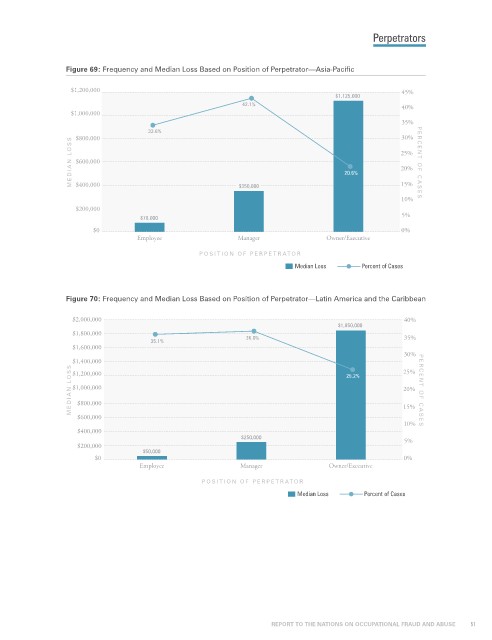
                 Figure 69: Frequency and Median Loss Based on Position of Perpetrator—Asia-Pacific

                  $1,200,000                                                                       45%
                                                                                   $1,125,000
                                                            42.1%                                  40%
                  $1,000,000
                                                                                                   35%
                                     33.6%
                    $800,000                                                                       30%
                  MEDIAN L OSS  $600,000                                             20.6%         25%  PERCENT OF CASES

                                                                                                   20%

                                                                                                   15%
                    $400,000
                                                            $350,000
                                                                                                   10%
                    $200,000
                                                                                                   5%
                                   $78,000
                        $0                                                                         0%
                                   Employee                Manager               Owner/Executive
                                                  POSITION OF PERPETRATOR
                                                                         Median Loss      Percent of Cases


                 Figure 70: Frequency and Median Loss Based on Position of Perpetrator—Latin America and the Caribbean

                   $2,000,000                                                                       40%
                                                                                    $1,850,000
                   $1,800,000
                                      35.1%                  36.0%                                  35%
                   $1,600,000
                                                                                                    30%
                   $1,400,000                                                                       25%
                  MEDIAN L OSS  $1,000,000                                            25.2%         20%  PERCENT OF CASES
                   $1,200,000


                    $800,000
                    $600,000                                                                        15%
                                                                                                    10%
                    $400,000
                                                            $250,000                                5%
                    $200,000
                                    $50,000
                        $0                                                                          0%
                                   Employee                 Manager               Owner/Executive
                                                  POSITION OF PERPETRATOR
                                                                          Median Loss     Percent of Cases


                                                                    REPORT TO THE NATIONS ON OCCUPATIONAL FRAUD AND ABUSE           51
   530   531   532   533   534   535   536   537   538   539   540