Page 533 - ACFE Fraud Reports 2009_2020
P. 533
Perpetrators


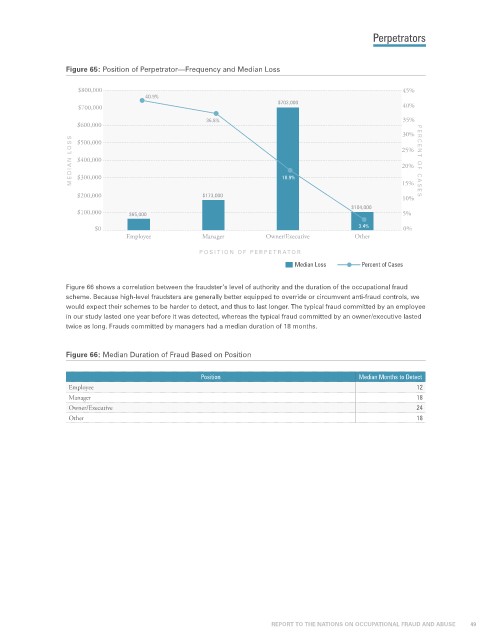
                 Figure 65: Position of Perpetrator—Frequency and Median Loss

                    $800,000                                                                        45%
                                     40.9%
                                                                     $703,000
                    $700,000                                                                        40%
                                                    36.8%                                           35%
                    $600,000
                                                                                                    30%
                  MEDIAN L OSS  $400,000                              18.9%                         25%  PERCENT OF CASES
                    $500,000

                                                                                                    20%
                    $300,000

                    $200,000                       $173,000                                         15%
                                                                                                    10%
                                                                                       $104,000
                    $100,000     $65,000                                                            5%
                        $0                                                               3.4%       0%
                                Employee           Manager        Owner/Executive       Other
                                                  POSITION OF PERPETRATOR
                                                                         Median Loss      Percent of Cases

                 Figure 66 shows a correlation between the fraudster’s level of authority and the duration of the occupational fraud
                 scheme. Because high-level fraudsters are generally better equipped to override or circumvent anti-fraud controls, we
                 would expect their schemes to be harder to detect, and thus to last longer. The typical fraud committed by an employee
                 in our study lasted one year before it was detected, whereas the typical fraud committed by an owner/executive lasted
                 twice as long. Frauds committed by managers had a median duration of 18 months.


                 Figure 66: Median Duration of Fraud Based on Position

                                                  Position                               Median Months to Detect
                  Employee                                                                             12
                  Manager                                                                              18
                  Owner/Executive                                                                      24
                  Other                                                                                18


                                                                    REPORT TO THE NATIONS ON OCCUPATIONAL FRAUD AND ABUSE           49

