Page 534 - ACFE Fraud Reports 2009_2020
P. 534
Perpetrators


                 Position of Perpetrator Based on Region
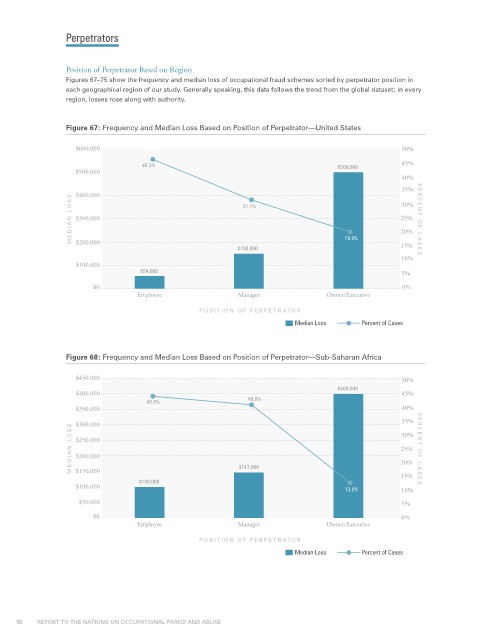
                 Figures 67–75 show the frequency and median loss of occupational fraud schemes sorted by perpetrator position in
                 each geographical region of our study. Generally speaking, this data follows the trend from the global dataset; in every
                 region, losses rose along with authority.


                 Figure 67: Frequency and Median Loss Based on Position of Perpetrator—United States

                    $600,000                                                                       50%

                                    45.3%                                           $500,000       45%
                    $500,000
                                                                                                   40%
                                                                                                   35%
                    $400,000                                 31.1%                                 30%
                  MEDIAN L OSS  $300,000                                                           25%  PERCENT OF CASES


                                                                                                   20%
                    $200,000
                                                           $150,000                   19.9%        15%
                                                                                                   10%
                    $100,000
                                   $54,000                                                         5%
                        $0                                                                          0%
                                   Employee                Manager               Owner/Executive

                                                  POSITION OF PERPETRATOR
                                                                         Median Loss      Percent of Cases


                 Figure 68: Frequency and Median Loss Based on Position of Perpetrator—Sub-Saharan Africa

                    $450,000                                                                       50%
                                                                                    $400,000
                    $400,000                                                                       45%
                                     43.8%                    40.8%
                    $350,000                                                                       40%
                                                                                                   35%
                    $300,000
                  MEDIAN L OSS  $250,000                                                           25%  PERCENT OF CASES
                                                                                                   30%
                    $200,000
                                                                                                   20%
                                                            $147,000
                    $150,000
                                                                                                   15%
                                   $100,000
                    $100,000                                                          13.5%        10%
                    $50,000                                                                        5%
                        $0                                                                         0%
                                   Employee                Manager               Owner/Executive
                                                  POSITION OF PERPETRATOR
                                                                         Median Loss      Percent of Cases


     50           REPORT TO THE NATIONS ON OCCUPATIONAL FRAUD AND ABUSE

