Page 538 - ACFE Fraud Reports 2009_2020
P. 538
Perpetrators


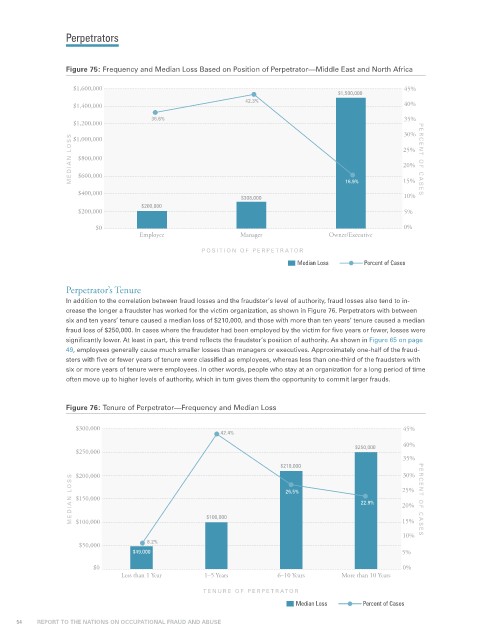
                 Figure 75: Frequency and Median Loss Based on Position of Perpetrator—Middle East and North Africa

                   $1,600,000                                                                       45%
                                                                                    $1,500,000
                                                             42.3%
                   $1,400,000                                                                       40%
                                      36.6%                                                         35%
                   $1,200,000
                                                                                                    30%
                  MEDIAN L OSS  $800,000                                                            25%  PERCENT OF CASES
                   $1,000,000

                                                                                                    20%
                    $600,000

                    $400,000                                                          16.9%         15%
                                                            $308,000                                10%
                                    $200,000
                    $200,000                                                                        5%
                        $0                                                                          0%
                                   Employee                 Manager               Owner/Executive

                                                  POSITION OF PERPETRATOR
                                                                          Median Loss     Percent of Cases


                 Perpetrator’s Tenure
                 In addition to the correlation between fraud losses and the fraudster’s level of authority, fraud losses also tend to in-
                 crease the longer a fraudster has worked for the victim organization, as shown in Figure 76. Perpetrators with between
                 six and ten years’ tenure caused a median loss of $210,000, and those with more than ten years’ tenure caused a median
                 fraud loss of $250,000. In cases where the fraudster had been employed by the victim for five years or fewer, losses were
                 significantly lower. At least in part, this trend reflects the fraudster’s position of authority. As shown in Figure 65 on page
                 49, employees generally cause much smaller losses than managers or executives. Approximately one-half of the fraud-
                 sters with five or fewer years of tenure were classified as employees, whereas less than one-third of the fraudsters with
                 six or more years of tenure were employees. In other words, people who stay at an organization for a long period of time
                 often move up to higher levels of authority, which in turn gives them the opportunity to commit larger frauds.


                 Figure 76: Tenure of Perpetrator—Frequency and Median Loss

                    $300,000                                                                        45%
                                                       42.4%
                                                                                                    40%
                                                                                        $250,000
                    $250,000
                                                                                                    35%
                                                                      $210,000                      30%
                    $200,000
                   MEDIAN L OSS  $150,000           $100,000           26.5%             22.9%      25%  PERCENT OF CASES


                                                                                                    20%
                                                                                                    15%
                    $100,000
                                                                                                    10%
                    $50,000          8.2%
                                  $49,000                                                           5%
                        $0                                                                          0%
                               Less than 1 Year    1–5 Years         6–10 Years      More than 10 Years

                                                   TENURE OF PERPETRATOR
                                                                          Median Loss     Percent of Cases

     54           REPORT TO THE NATIONS ON OCCUPATIONAL FRAUD AND ABUSE

