Page 540 - ACFE Fraud Reports 2009_2020
P. 540
Perpetrators


                 Schemes Based on Perpetrator’s Department
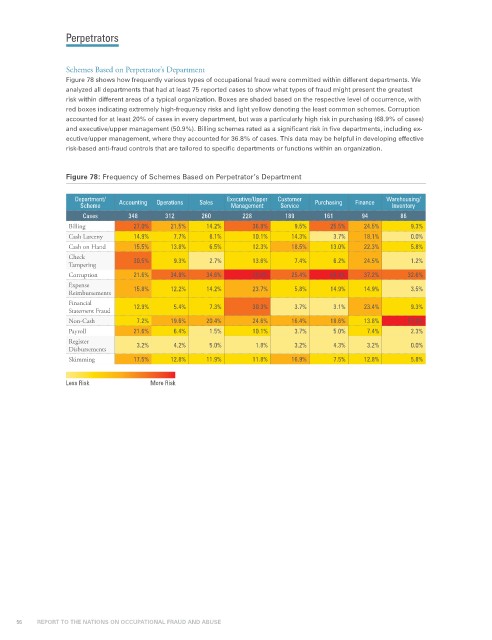
                 Figure 78 shows how frequently various types of occupational fraud were committed within different departments. We
                 analyzed all departments that had at least 75 reported cases to show what types of fraud might present the greatest
                 risk within different areas of a typical organization. Boxes are shaded based on the respective level of occurrence, with
                 red boxes indicating extremely high-frequency risks and light yellow denoting the least common schemes. Corruption
                 accounted for at least 20% of cases in every department, but was a particularly high risk in purchasing (68.9% of cases)
                 and executive/upper management (50.9%). Billing schemes rated as a significant risk in five departments, including ex-
                 ecutive/upper management, where they accounted for 36.8% of cases. This data may be helpful in developing effective
                 risk-based anti-fraud controls that are tailored to specific departments or functions within an organization.


                 Figure 78: Frequency of Schemes Based on Perpetrator’s Department


                   Department/  Accounting  Operations  Sales  Executive/Upper   Customer   Purchasing  Finance  Warehousing/
                     Scheme                               Management  Service                    Inventory
                     Cases      348       312     260       228        189      161       94       86
                  Billing         27.0%    21.5%    14.2%      36.8%     9.5%     25.5%   24.5%       9.3%
                  Cash Larceny    14.9%     7.7%    8.1%       10.1%    14.3%      3.7%   18.1%       0.0%
                  Cash on Hand    15.5%    13.8%    6.5%       12.3%    18.5%     13.0%   22.3%       5.8%
                  Check           30.5%     9.3%    2.7%       13.6%     7.4%      6.2%   24.5%       1.2%
                  Tampering
                  Corruption      21.6%    34.9%    34.6%      50.9%    25.4%     68.9%   37.2%      32.6%
                  Expense         15.8%    12.2%    14.2%      23.7%     5.8%     14.9%   14.9%       3.5%
                  Reimbursements
                  Financial       12.9%     5.4%    7.3%       30.3%     3.7%      3.1%   23.4%       9.3%
                  Statement Fraud
                  Non-Cash         7.2%    19.6%    20.4%      24.6%    16.4%     18.6%   13.8%      57.0%
                  Payroll         21.6%     6.4%    1.5%       10.1%     3.7%      5.0%    7.4%       2.3%
                  Register         3.2%     4.2%    5.0%        1.8%     3.2%      4.3%    3.2%       0.0%
                  Disbursements
                  Skimming        17.5%    12.8%    11.9%      11.8%    16.9%      7.5%   12.8%       5.8%


                 Less Risk                                       More Risk


     56           REPORT TO THE NATIONS ON OCCUPATIONAL FRAUD AND ABUSE

