
Page 94 - FlipBook BACK FROM SARAN - MAY 5 2020 - Don't Make Me Say I Told You So_6.14x9.21_v9_Neat
P. 94
80 Don’t Make Me Say I Told You So
Stocks, Bonds, Bills and Inflation 1926-2020
$100,000
$39,381
$10,000
$9,244
Compound annual return
PLEASE REPLACE THIS CHART WITH THE UPDATED
1,000 Small stocks 11.9%
Large Stocks
VERSION. #114 STOCKS, BONDS, BILLS AND
10.0
5.5
Government bonds
Treasury bills 3.3
INFLATION - 1926 - 2019. IT'S IN OUR SHARED $159
2.9
In ation
100
DROPBOX FOLDER.
$22
$14
10
1
0.10
1926 1936 1946 1956 1966 1976 1986 1996 2006 2016
Source: Morningstar, 2020
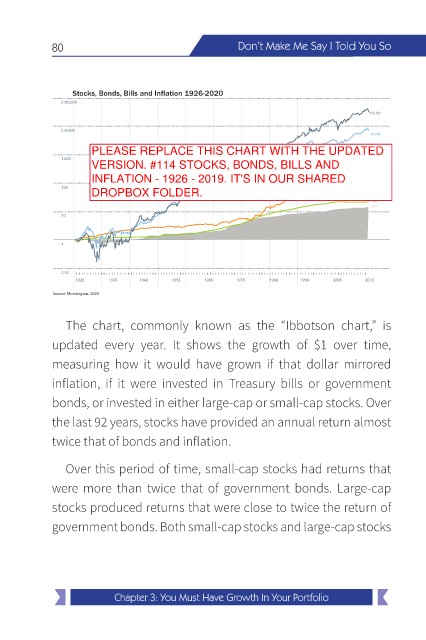
The chart, commonly known as the “Ibbotson chart,” is
updated every year. It shows the growth of $1 over time,
measuring how it would have grown if that dollar mirrored
inflation, if it were invested in Treasury bills or government
bonds, or invested in either large-cap or small-cap stocks. Over
the last 92 years, stocks have provided an annual return almost
twice that of bonds and inflation.
Over this period of time, small-cap stocks had returns that
were more than twice that of government bonds. Large-cap
stocks produced returns that were close to twice the return of
government bonds. Both small-cap stocks and large-cap stocks
Chapter 3: You Must Have Growth In Your Portfolio