
Page 96 - FlipBook BACK FROM SARAN - MAY 5 2020 - Don't Make Me Say I Told You So_6.14x9.21_v9_Neat
P. 96
82 Don’t Make Me Say I Told You So
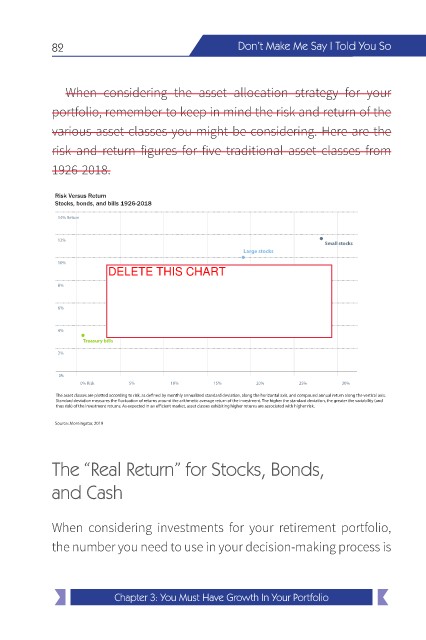
When considering the asset allocation strategy for your
portfolio, remember to keep in mind the risk and return of the
various asset classes you might be considering. Here are the
risk and return figures for five traditional asset classes from
1926-2018.
Risk Versus Return
Stocks, bonds, and bills 1926-2018
14% Return
12%
Small stocks
Large stocks
10%
DELETE THIS CHART
8%
6% Long-term government bonds
Intermediate-term government bonds
4%
Treasury bills
2%
0%
0% Risk 5% 10% 15% 20% 25% 30%
The asset classes are plotted according to risk, as de ned by monthly annualized standard deviation, along the horizontal axis, and compound annual return along the vertical axis.
Standard deviation measures the uctuation of returns around the arithmetic average return of the investment. The higher the standard deviation, the greater the variability (and
thus risk) of the investment returns. As expected in an e cient market, asset classes exhibiting higher returns are associated with higher risk.
Source: Morningstar, 2019
The “Real Return” for Stocks, Bonds,
and Cash
When considering investments for your retirement portfolio,
the number you need to use in your decision-making process is
Chapter 3: You Must Have Growth In Your Portfolio