
Page 391 - Adams and Stashak's Lameness in Horses, 7th Edition
P. 391
Diagnostic Imaging 357
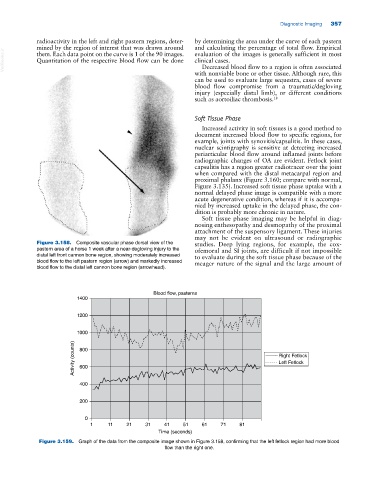
radioactivity in the left and right pastern regions, deter by determining the area under the curve of each pastern
mined by the region of interest that was drawn around and calculating the percentage of total flow. Empirical
VetBooks.ir Quantitation of the respective blood flow can be done clinical cases.
evaluation of the images is generally sufficient in most
them. Each data point on the curve is 1 of the 90 images.
Decreased blood flow to a region is often associated
with nonviable bone or other tissue. Although rare, this
can be used to evaluate large sequestra, cases of severe
blood flow compromise from a traumatic/degloving
injury (especially distal limb), or different conditions
such as aortoiliac thrombosis. 18
Soft Tissue Phase
Increased activity in soft tissues is a good method to
document increased blood flow to specific regions, for
example, joints with synovitis/capsulitis. In these cases,
nuclear scintigraphy is sensitive at detecting increased
periarticular blood flow around inflamed joints before
radiographic changes of OA are evident. Fetlock joint
capsulitis has a region greater radiotracer over the joint
when compared with the distal metacarpal region and
proximal phalanx (Figure 3.160; compare with normal,
Figure 3.135). Increased soft tissue phase uptake with a
normal delayed phase image is compatible with a more
acute degenerative condition, whereas if it is accompa
nied by increased uptake in the delayed phase, the con
dition is probably more chronic in nature.
Soft tissue phase imaging may be helpful in diag
nosing enthesopathy and desmopathy of the proximal
attachment of the suspensory ligament. These injuries
may not be evident on ultrasound or radiographic
Figure 3.158. Composite vascular phase dorsal view of the studies. Deep lying regions, for example, the cox
pastern area of a horse 1 week after a near‐degloving injury to the ofemoral and SI joints, are difficult if not impossible
distal left front cannon bone region, showing moderately increased to evaluate during the soft tissue phase because of the
blood flow to the left pastern region (arrow) and markedly increased meager nature of the signal and the large amount of
blood flow to the distal left cannon bone region (arrowhead).
Blood flow, pasterns
1400
1200
1000
Activity (counts) 800 Right Fetlock
Left Fetlock
600
400
200
0
1 11 21 31 41 51 61 71 81
Time (seconds)
Figure 3.159. Graph of the data from the composite image shown in Figure 3.158, confirming that the left fetlock region had more blood
flow than the right one.