
Page 392 - Adams and Stashak's Lameness in Horses, 7th Edition
P. 392
358 Chapter 3
other tissues between the hip and the camera. These Care must be taken to not overinterpret soft tissue
tissues make up several half‐value layers (a layer of phase images when severe increased uptake is also seen
VetBooks.ir half), which attenuate the beam significantly before spots” in these cases often represent early bone uptake.
in the delayed phase images. Soft tissue phase “hot
tissue resulting in the reduction of the signal by one
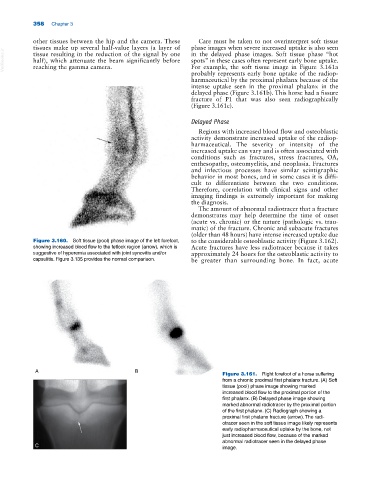
For example, the soft tissue image in Figure 3.161a
reaching the gamma camera.
probably represents early bone uptake of the radiop
harmaceutical by the proximal phalanx because of the
intense uptake seen in the proximal phalanx in the
delayed phase (Figure 3.161b). This horse had a fissure
fracture of P1 that was also seen radiographically
(Figure 3.161c).
Delayed Phase
Regions with increased blood flow and osteoblastic
activity demonstrate increased uptake of the radiop
harmaceutical. The severity or intensity of the
increased uptake can vary and is often associated with
conditions such as fractures, stress fractures, OA,
enthesopathy, osteomyelitis, and neoplasia. Fractures
and infectious processes have similar scintigraphic
behavior in most bones, and in some cases it is diffi
cult to differentiate between the two conditions.
Therefore, correlation with clinical signs and other
imaging findings is extremely important for making
the diagnosis.
The amount of abnormal radiotracer that a fracture
demonstrates may help determine the time of onset
(acute vs. chronic) or the nature (pathologic vs. trau
matic) of the fracture. Chronic and subacute fractures
(older than 48 hours) have intense increased uptake due
Figure 3.160. Soft tissue (pool) phase image of the left forefoot, to the considerable osteoblastic activity (Figure 3.162).
showing increased blood flow to the fetlock region (arrow), which is Acute fractures have less radiotracer because it takes
suggestive of hyperemia associated with joint synovitis and/or approximately 24 hours for the osteoblastic activity to
capsulitis. Figure 3.135 provides the normal comparison. be greater than surrounding bone. In fact, acute
A B
Figure 3.161. Right forefoot of a horse suffering
from a chronic proximal first phalanx fracture. (A) Soft
tissue (pool) phase image showing marked
increased blood flow to the proximal portion of the
first phalanx. (B) Delayed phase image showing
marked abnormal radiotracer by the proximal portion
of the first phalanx. (C) Radiograph showing a
proximal first phalanx fracture (arrow). The radi
otracer seen in the soft tissue image likely represents
early radiopharmaceutical uptake by the bone, not
just increased blood flow, because of the marked
abnormal radiotracer seen in the delayed phase
C image.