
Page 390 - Adams and Stashak's Lameness in Horses, 7th Edition
P. 390
356 Chapter 3
VetBooks.ir
Figure 3.155. Delayed phase left lateral view of the cranial
cervical region of a normal horse. Note the normal radiotracer in the
region of the dens (arrow).
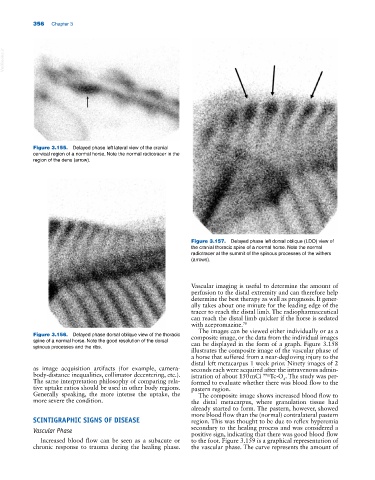
Figure 3.157. Delayed phase left dorsal oblique (LDO) view of
the cranial thoracic spine of a normal horse. Note the normal
radiotracer at the summit of the spinous processes of the withers
(arrows).
Vascular imaging is useful to determine the amount of
perfusion to the distal extremity and can therefore help
determine the best therapy as well as prognosis. It gener
ally takes about one minute for the leading edge of the
tracer to reach the distal limb. The radiopharmaceutical
can reach the distal limb quicker if the horse is sedated
with acepromazine. 78
The images can be viewed either individually or as a
Figure 3.156. Delayed phase dorsal oblique view of the thoracic composite image, or the data from the individual images
spine of a normal horse. Note the good resolution of the dorsal can be displayed in the form of a graph. Figure 3.158
spinous processes and the ribs.
illustrates the composite image of the vascular phase of
a horse that suffered from a near‐degloving injury to the
distal left metacarpus 1 week prior. Ninety images of 2
as image acquisition artifacts (for example, camera‐ seconds each were acquired after the intravenous admin
body‐distance inequalities, collimator decentering, etc.). istration of about 150 mCi 99m Tc‐O . The study was per
4
The same interpretation philosophy of comparing rela formed to evaluate whether there was blood flow to the
tive uptake ratios should be used in other body regions. pastern region.
Generally speaking, the more intense the uptake, the The composite image shows increased blood flow to
more severe the condition. the distal metacarpus, where granulation tissue had
already started to form. The pastern, however, showed
more blood flow than the (normal) contralateral pastern
SCINTIGRAPHIC SIGNS OF DISEASE region. This was thought to be due to reflex hyperemia
Vascular Phase secondary to the healing process and was considered a
positive sign, indicating that there was good blood flow
Increased blood flow can be seen as a subacute or to the foot. Figure 3.159 is a graphical representation of
chronic response to trauma during the healing phase. the vascular phase. The curve represents the amount of