
Page 57 - Ecobank Gambia Annual Report 2020
P. 57
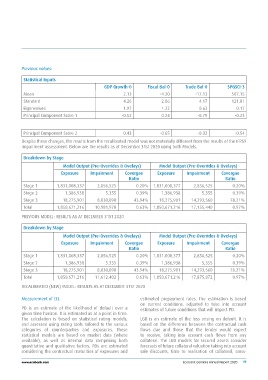
Previous values:                GDP Growth-0                Fiscal Bal-0           Trade Bal-0    SPGSCI-3
                                            2.13                    -4.20                -17.13     507.15
 Statistical Inputs                         4.26                     2.06                   4.17    121.81
                                            1.97                     1.22                   0.63       0.17
 Mean                                      -0.52                     0.24                  -0.79      -0.23
 Standard
 Eigenvalues
 Principal Component Score 1

Principal Component Score 2                 0.43                    -0.65          -0.32          -0.54

Despite these changes, the results from the recalibrated model was not materially different from the results of the IFRS9
impairment assessment. Below are the results as at December 31st 2020 using both Models.

Breakdown by Stage

                 Model Output (Pre-Overrides & Ovelays)             Model Output (Pre-Overrides & Ovelays)

                 Exposure       Impairment        Covergae          Exposure       Impairment     Covergae
                                                    Ratio                                           Ratio

Stage 1          1,831,008,337  2,856,525                   0.20%   1,831,008,377  2,856,525      0.20%
Stage 2
Stage 3             1,386,938   5.355                       0.39%   1,386,938      5,355          0.39%
Total
                 18,275,901     8,030,090                   43.94%  18,275,901 14,293,560         78.21%

                 1,850,671,216 10,981,970                   0.63%   1,850,671,216 17,155,440      0.97%

PREVIOUS MODEL: RESULTS AS AT DECEMBER 31ST 2020

Breakdown by Stage

                 Model Output (Pre-Overrides & Ovelays)             Model Output (Pre-Overrides & Ovelays)

                 Exposure       Impairment        Covergae          Exposure       Impairment     Covergae
                                                    Ratio                                           Ratio

Stage 1          1,831,008,337  2,856,525                   0.20%   1,831,008,377  2,856,525      0.20%
Stage 2
Stage 3             1,386,938   5.355                       0.39%   1,386,938      5,355          0.39%
Total
                 18,275,901     8,030,090                   43.94%  18,275,901 14,293,560         78.21%

                 1,850,671,216 11,612,402                   0.63%   1,850,671,216 17,875,872      0.97%

RECALIBRATED (NEW) MODEL: RESULTS AS AT DECEMBER 31ST 2020

Measurement of ECL                                          estimated prepayment rates. The estimation is based
PD is an estimate of the likelihood of default over a       on current conditions, adjusted to take into account
given time horizon. It is estimated as at a point in time.  estimates of future conditions that will impact PD.
The calculation is based on statistical rating models,      LGD is an estimate of the loss arising on default. It is
and assessed using rating tools tailored to the various     based on the difference between the contractual cash
categories of counterparties and exposures. These           flows due and those that the lender would expect
statistical models are based on market data (where          to receive, taking into account cash flows from any
available), as well as internal data comprising both        collateral. The LGD models for secured assets consider
quantitative and qualitative factors. PDs are estimated     forecasts of future collateral valuation taking into account
considering the contractual maturities of exposures and     sale discounts, time to realisation of collateral, cross-

www.ecobank.com                                                                    Ecobank Gambia Annual Report 2020 55