
Page 21 - GP Fall 2020
P. 21
24
!
23
!
A data report was then created for each ex- value among the groups; IPS e.max Press opposing enamel compared to the docu-
perimental specimen indicating the enamel system was 39.75 μm ; IPS e.max CAD mented wear values of natural teeth when
3
volume and height loss in mu. One investi- Table II. Descriptive statistics for volume loss (mu)
was 40.58 μm ; Noritake Super Porcelain followed up to one year. This one-year wear
3
gator performed all the testing. EX-3 system was 45.08 μm ; and the Lava value of enamel opposing monolithic zir-
3
Plus Zirconia system was 48.66 μm . conia crowns was less than wear produced
3
Statistical Analysis by popular ceramic materials such as felds-
A power calculation was conducted using Mean pathic porcelain and lithium disilicate. 52
nQuery Advisor (Version 7.0). Assuming an Group N Volume Loss SD Min Max
effect size of Δ = 0.485 (the effect size that EP 12 39.75 7.33 29 55 Even though previous in-vivo studies have
2
was observed in a pilot study using 3 spec- EC 12 40.58 13.26 25 72 shown that ceramic materials are wear-re-
imens per group), a sample size of twelve SP 12 45.08 16.64 23 82 sistant, 10,16 these materials may damage the
(n = 12) per group was adequate to obtain a LPZ 12 48.66 14.85 31 81 opposing enamel, which varies according to
Type I error rate of 5% and a power greater E 12 37.08 11.88 16 56 the ceramic material composition. 35-38 How-
than 99%. ever, clinical wear measurements in general
Total 60 42.23 13.38 16 82 are complicated, expensive, and time-con-
Table III. Descriptive statistics for height loss (mu)
Descriptive statistics (means, SD’s, minima, Significance (p-value): 0.225 suming. In addition, such studies can result
and maxima) were calculated. One-way F-value=1.5, df=4 and 55 in relatively high standard deviations due
analysis of variance (ANOVA) was used Levene’s significance: 0.21 to the biological spread between the stud-
to assess statistical significance. All anal- ied individuals in terms of dietary habits,
yses were conducted by using the software Table II. Descriptive statistics for volume loss (mu). dysfunctional occlusion, biting force, and
package IBM SPSS Statistics version 19.0 bruxism. 21,52 !28
(SPSS). P-values less than .05 were consid- Group N Mean SD Min Max
Volume Loss
ered statistically significant. The results of previous in vitro studies, in
EP 12 33.25 8.2 18 44
which a specific material and the antagonist
Results EC 12 27.91 6.8 18 44 wear of the human enamel were examined,
Descriptive statistics are shown in Table II SP 12 34.75 13.2 21 63 have been inconsistent, mainly due to the
and Table III, and the data are presented as LPZ 12 27.50 7.4 17 41 fact that the test parameters differed wide-!28
side-by-side box-plots in Figures 5, 6. E 12 29.08 4.6 20 36 ly. 21-25,29,30,34-38,53 Most studies have used flat
The mean value of opposing enamel volume Total 60 30.50 8.8 17 63 polished ceramics and prepared enamel
specimens from extracted molars as their
loss for enamel disks of the control group Significance (p-value): 0.149 antagonists with test chambers filled with
was 37.08 μm , which was the lowest mean F-value=1.8, df=4 and 55 water and integrated sliding movements in
3
Levene’s significance: 0.06 the wear generating processes. However,
Table III. Descriptive statistics for height loss (mu). there have been huge variations in relation
to force actuators, applied forces, numbers
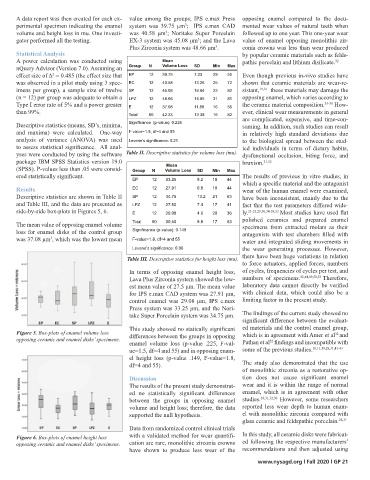
In terms of opposing enamel height loss, of cycles, frequencies of cycles per test, and
Lava Plus Zirconia system showed the low- numbers of specimens. 42,44,49,51,53 Therefore,
! est mean value of 27.5 μm. The mean value laboratory data cannot directly be verified
for IPS e.max CAD system was 27.91 μm, with clinical data, which could also be a
control enamel was 29.08 μm, IPS e.max limiting factor in the present study.
Press system was 33.25 μm, and the Nori-
Figure 6. Box-plots of enamel height loss opposing ceramic and enamel disks’
take Super Porcelain system was 34.75 μm. The findings of the current study showed no
significant difference between the evaluat-
specimens. This study showed no statically significant ed materials and the control enamel group,
Figure 5. Box-plots of enamel volume loss
32
opposing ceramic and enamel disks’ specimens. differences between the groups in opposing which is in agreement with Amer et al and
52
enamel volume loss (p-value .225, F-val- Pathan et al findings and incompatible with
! ue=1.5, df=4 and 55) and in opposing enam- some of the previous studies. 10,11,19,28,31,41-43
el height loss (p-value .149, F-value=1.8,
df=4 and 55). The study also demonstrated that the use
of monolithic zirconia as a restorative op-
Figure 6. Box-plots of enamel height loss opposing ceramic and enamel disks’
tion does not cause significant enamel
Discussion
The results of the present study demonstrat- wear and it is within the range of normal
specimens. ed no statistically significant differences enamel, which is in agreement with other
However, some researchers
between the groups in opposing enamel studies.
28,31,32,50
volume and height loss; therefore, the data reported less wear depth to human enam-
supported the null hypothesis. el with monolithic zirconia compared with
glass ceramic and feldspathic porcelain. 28,31
Data from randomized control clinical trials
Figure 6. Box-plots of enamel height loss with a validated method for wear quantifi- In this study, all ceramic disks were fabricat-
opposing ceramic and enamel disks’ specimens. cation are rare, monolithic zirconia crowns ed following the respective manufacturers’
! have shown to produce less wear of the recommendations and then adjusted using
www.nysagd.org l Fall 2020 l GP 21
About the Authors:
Dr. Roya Zandparsa is a Clinical Professor, Postgraduate Prosthodon>cs and Advanced Educa>on in
Esthe>c Den>stry, Prosthodon>c Division, TuBs University School of Dental Medicine, Boston, MA.
Dr. Rabie El huni is an Assistant Lecturer and Clinical Supervisor in the Department of Prosthodon>cs,
Faculty of Den>stry at the University of Benghazi in Benghazi, Libya.
! Dr. Hiroshi Hirayama is a Professor at the Boston University School of Dental Medicine in Boston, MA.
Mr. Mark Johnson is the president of Texture Technology Corpora>on.
About the Authors:
Dr. Roya Zandparsa is a Clinical Professor, Postgraduate Prosthodon>cs and Advanced Educa>on in
Esthe>c Den>stry, Prosthodon>c Division, TuBs University School of Dental Medicine, Boston, MA.
Dr. Rabie El huni is an Assistant Lecturer and Clinical Supervisor in the Department of Prosthodon>cs,
Faculty of Den>stry at the University of Benghazi in Benghazi, Libya.
Dr. Hiroshi Hirayama is a Professor at the Boston University School of Dental Medicine in Boston, MA.
Mr. Mark Johnson is the president of Texture Technology Corpora>on.