
Page 236 - Six Sigma Advanced Tools for Black Belts and Master Black Belts
P. 236
Char Count= 0
August 31, 2006
JWBK119-14
3:4
References 221
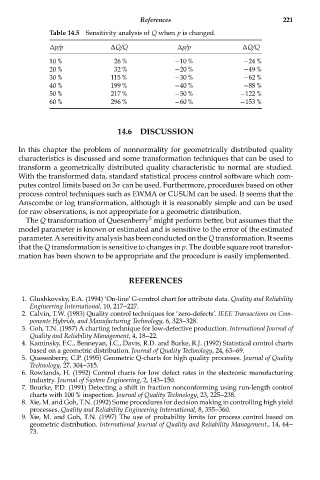
Table 14.5 Sensitivity analysis of Q when p is changed.
p/p Q/Q p/p Q/Q
10 % 26 % −10 % −24 %
20 % 32 % −20 % −49 %
30 % 115 % −30 % −62 %
40 % 199 % −40 % −88 %
50 % 217 % −50 % −122 %
60 % 296 % −60 % −153 %
14.6 DISCUSSION
In this chapter the problem of nonnormality for geometrically distributed quality
characteristics is discussed and some transformation techniques that can be used to
transform a geometrically distributed quality characteristic to normal are studied.
With the transformed data, standard statistical process control software which com-
putes control limits based on 3σ can be used. Furthermore, procedures based on other
process control techniques such as EWMA or CUSUM can be used. It seems that the
Anscombe or log transformation, although it is reasonably simple and can be used
for raw observations, is not appropriate for a geometric distribution.
5
The Q transformation of Quesenberry might perform better, but assumes that the
model parameter is known or estimated and is sensitive to the error of the estimated
parameter. AsensitivityanalysishasbeenconductedontheQtransformation. Itseems
that the Q transformation is sensitive to changes in p. The double square root transfor-
mation has been shown to be appropriate and the procedure is easily implemented.
REFERENCES
1. Glushkovsky, E.A. (1994) ‘On-line’ G-control chart for attribute data. Quality and Reliability
Engineering International, 10, 217--227.
2. Calvin, T.W. (1983) Quality control techniques for ‘zero-defects’. IEEE Transactions on Com-
ponents Hybrids, and Manufacturing Technology, 6, 323--328.
3. Goh, T.N. (1987) A charting technique for low-defective production. International Journal of
Quality and Reliability Management, 4, 18--22.
4. Kaminsky, F.C., Benneyan, J.C., Davis, R.D. and Burke, R.J. (1992) Statistical control charts
based on a geometric distribution. Journal of Quality Technology, 24, 63--69.
5. Quesenberry, C.P. (1995) Geometric Q-charts for high quality processes. Journal of Quality
Technology, 27, 304--315.
6. Rowlands, H. (1992) Control charts for low defect rates in the electronic manufacturing
industry. Journal of System Engineering, 2, 143--150.
7. Bourke, P.D. (1991) Detecting a shift in fraction nonconforming using run-length control
charts with 100 % inspection. Journal of Quality Technology, 23, 225--238.
8. Xie, M. and Goh, T.N. (1992) Some procedures for decision making in controlling high yield
processes. Quality and Reliability Engineering International, 8, 355--360.
9. Xie, M. and Goh, T.N. (1997) The use of probability limits for process control based on
geometric distribution. International Journal of Quality and Reliability Management., 14, 64--
73.