
Page 235 - Six Sigma Advanced Tools for Black Belts and Master Black Belts
P. 235
Char Count= 0
3:4
August 31, 2006
JWBK119-14
220 Data Transformation for Geometrically Distributed Quality Characteristics
250
UCL 211
200
150
X
100
MEAN 65
50
0 LCL 0
0 35 70 105 140 175 210
Row Numbers
5
4.5 UCL 4.34
4
3.5
X^(1/4) 2.5 3 2 MEAN 2.69
1.5
1 LCL 1.04
0.5
0
0 35 70 105 140 175 210
Row Numbers
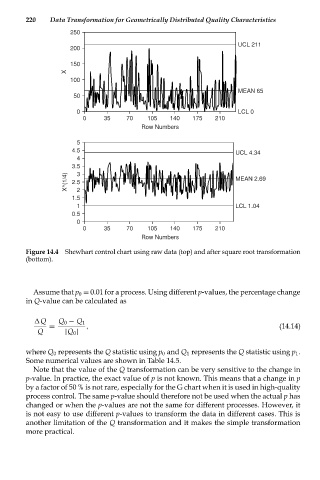
Figure 14.4 Shewhart control chart using raw data (top) and after square root transformation
(bottom).
Assume that p 0 = 0.01 for a process. Using different p-values, the percentage change
in Q-value can be calculated as
Q Q 0 − Q 1
= , (14.14)
Q |Q 0 |
where Q 0 represents the Q statistic using p 0 and Q 1 represents the Q statistic using p 1 .
Some numerical values are shown in Table 14.5.
Note that the value of the Q transformation can be very sensitive to the change in
p-value. In practice, the exact value of p is not known. This means that a change in p
by a factor of 50 % is not rare, especially for the G chart when it is used in high-quality
process control. The same p-value should therefore not be used when the actual p has
changed or when the p-values are not the same for different processes. However, it
is not easy to use different p-values to transform the data in different cases. This is
another limitation of the Q transformation and it makes the simple transformation
more practical.