
Page 232 - Six Sigma Advanced Tools for Black Belts and Master Black Belts
P. 232
Char Count= 0
3:4
August 31, 2006
JWBK119-14
5
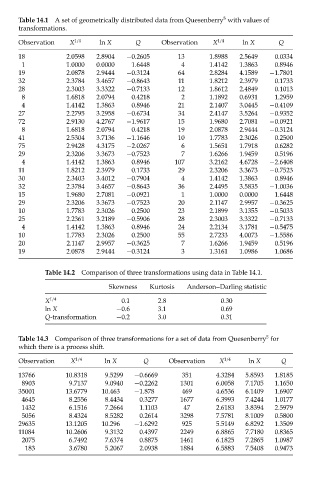
Table 14.1 A set of geometrically distributed data from Quesenberry with values of
transformations.
Observation X 1/4 ln X Q Observation X 1/4 ln X Q
18 2.0598 2.8904 −0.2605 13 1.8988 2.5649 0.0334
1 1.0000 0.0000 1.6448 4 1.4142 1.3863 0.8946
19 2.0878 2.9444 −0.3124 64 2.8284 4.1589 −1.7801
32 2.3784 3.4657 −0.8643 11 1.8212 2.3979 0.1733
28 2.3003 3.3322 −0.7133 12 1.8612 2.4849 0.1013
8 1.6818 2.0794 0.4218 2 1.1892 0.6931 1.2959
4 1.4142 1.3863 0.8946 21 2.1407 3.0445 −0.4109
27 2.2795 3.2958 −0.6734 34 2.4147 3.5264 −0.9352
72 2.9130 4.2767 −1.9617 15 1.9680 2.7081 −0.0921
8 1.6818 2.0794 0.4218 19 2.0878 2.9444 −0.3124
41 2.5304 3.7136 −1.1646 10 1.7783 2.3026 0.2500
75 2.9428 4.3175 −2.0267 6 1.5651 1.7918 0.6282
29 2.3206 3.3673 −0.7523 7 1.6266 1.9459 0.5196
4 1.4142 1.3863 0.8946 107 3.2162 4.6728 −2.6408
11 1.8212 2.3979 0.1733 29 2.3206 3.3673 −0.7523
30 2.3403 3.4012 −0.7904 4 1.4142 1.3863 0.8946
32 2.3784 3.4657 −0.8643 36 2.4495 3.5835 −1.0036
15 1.9680 2.7081 −0.0921 1 1.0000 0.0000 1.6448
29 2.3206 3.3673 −0.7523 20 2.1147 2.9957 −0.3625
10 1.7783 2.3026 0.2500 23 2.1899 3.1355 −0.5033
25 2.2361 3.2189 −0.5906 28 2.3003 3.3322 −0.7133
4 1.4142 1.3863 0.8946 24 2.2134 3.1781 −0.5475
10 1.7783 2.3026 0.2500 55 2.7233 4.0073 −1.5586
20 2.1147 2.9957 −0.3625 7 1.6266 1.9459 0.5196
19 2.0878 2.9444 −0.3124 3 1.3161 1.0986 1.0686
Table 14.2 Comparison of three transformations using data in Table 14.1.
Skewness Kurtosis Anderson--Darling statistic
X 1/4 0.1 2.8 0.30
ln X −0.6 3.1 0.69
Q-transformation −0.2 3.0 0.31
5
Table 14.3 Comparison of three transformations for a set of data from Quesenberry for
which there is a process shift.
Observation X 1/4 ln X Q Observation X 1/4 ln X Q
13766 10.8318 9.5299 −0.6669 351 4.3284 5.8593 1.8185
8903 9.7137 9.0940 −0.2262 1301 6.0058 7.1705 1.1650
35001 13.6779 10.463 −1.878 469 4.6536 6.1409 1.6907
4645 8.2556 8.4434 0.3277 1677 6.3993 7.4244 1.0177
1432 6.1516 7.2664 1.1103 47 2.6183 3.8394 2.5979
5056 8.4324 8.5282 0.2614 3298 7.5781 8.1009 0.5800
29635 13.1205 10.296 −1.6292 925 5.5149 6.8292 1.3509
11084 10.2606 9.3132 0.4397 2249 6.8865 7.7180 0.8365
2075 6.7492 7.6374 0.8875 1461 6.1825 7.2865 1.0987
183 3.6780 5.2067 2.0938 1884 6.5883 7.5408 0.9473
217