
Page 344 - Six Sigma Advanced Tools for Black Belts and Master Black Belts
P. 344
OTE/SPH
OTE/SPH
Char Count= 0
3:7
August 31, 2006
JWBK119-21
CCC Scheme with Estimated Parameter 329
400
350
300
250
ARL 200
150
100 m = 5 m = 10
m = 30 m = 50
50
known p
0
0 0.5 1 1.5 2 2.5
ρ = p/p 0
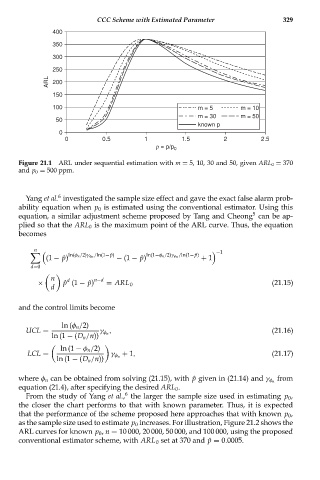
Figure 21.1 ARL under sequential estimation with m = 5, 10, 30 and 50, given ARL 0 = 370
and p 0 = 500 ppm.
6
Yang et al. investigated the sample size effect and gave the exact false alarm prob-
ability equation when p 0 is estimated using the conventional estimator. Using this
5
equation, a similar adjustment scheme proposed by Tang and Cheong can be ap-
plied so that the ARL 0 is the maximum point of the ARL curve. Thus, the equation
becomes
−1
n
ln(φ n /2)γ φn /ln(1− ˆp) ln(1−φ n /2)γ φn /ln(1− ˆp)
(1 − ˆp) − (1 − ˆp) + 1
d=0
n d n−d
× ˆ p (1 − ˆp) = ARL 0 (21.15)
d
and the control limits become
ln (φ n /2)
UCL = γ φ n , (21.16)
ln (1 − (D n /n))
ln (1 − φ n /2)
LCL = γ φ n + 1, (21.17)
ln (1 − (D n /n))
from
where φ n can be obtained from solving (21.15), with ˆp given in (21.14) and γ φ n
equation (21.4), after specifying the desired ARL 0 .
6
From the study of Yang et al., the larger the sample size used in estimating p 0 ,
the closer the chart performs to that with known parameter. Thus, it is expected
that the performance of the scheme proposed here approaches that with known p 0 ,
as the sample size used to estimate p 0 increases. For illustration, Figure 21.2 shows the
ARL curves for known p 0 , n = 10 000, 20 000, 50 000, and 100 000, using the proposed
conventional estimator scheme, with ARL 0 set at 370 and ˆp = 0.0005.