
Page 346 - Six Sigma Advanced Tools for Black Belts and Master Black Belts
P. 346
OTE/SPH
OTE/SPH
Char Count= 0
3:7
August 31, 2006
JWBK119-21
Constructing a CCC Chart 331
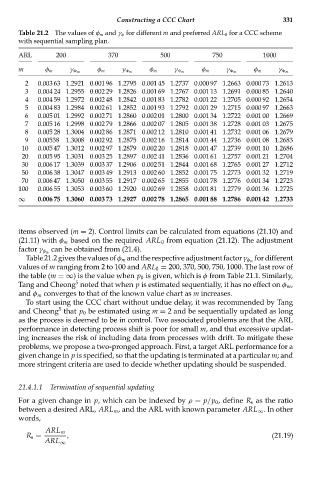
Table 21.2 The values of φ m and γ φ for different m and preferred ARL 0 for a CCC scheme
with sequential sampling plan.
ARL 200 370 500 750 1000
m φ m γ m φ m γ m φ m γ m φ m γ m φ m γ m
2 0.003 63 1.2921 0.001 96 1.2795 0.001 45 1.2737 0.000 97 1.2663 0.000 73 1.2613
3 0.004 24 1.2955 0.002 29 1.2826 0.001 69 1.2767 0.001 13 1.2691 0.000 85 1.2640
4 0.004 59 1.2972 0.002 48 1.2842 0.001 83 1.2782 0.001 22 1.2705 0.000 92 1.2654
5 0.004 83 1.2984 0.002 61 1.2852 0.001 93 1.2792 0.001 29 1.2715 0.000 97 1.2663
6 0.005 01 1.2992 0.002 71 1.2860 0.002 01 1.2800 0.001 34 1.2722 0.001 00 1.2669
7 0.005 16 1.2998 0.002 79 1.2866 0.002 07 1.2805 0.001 38 1.2728 0.001 03 1.2675
8 0.005 28 1.3004 0.002 86 1.2871 0.002 12 1.2810 0.001 41 1.2732 0.001 06 1.2679
9 0.00538 1.3008 0.002 92 1.2875 0.002 16 1.2814 0.001 44 1.2736 0.001 08 1.2683
10 0.005 47 1.3012 0.002 97 1.2879 0.002 20 1.2818 0.001 47 1.2739 0.001 10 1.2686
20 0.005 95 1.3031 0.003 25 1.2897 0.002 41 1.2836 0.001 61 1.2757 0.001 21 1.2704
30 0.006 17 1.3039 0.003 37 1.2906 0.002 51 1.2844 0.001 68 1.2765 0.001 27 1.2712
50 0.006 38 1.3047 0.003 49 1.2913 0.002 60 1.2852 0.001 75 1.2773 0.001 32 1.2719
70 0.006 47 1.3050 0.003 55 1.2917 0.002 65 1.2855 0.001 78 1.2776 0.001 34 1.2723
100 0.006 55 1.3053 0.003 60 1.2920 0.002 69 1.2858 0.001 81 1.2779 0.001 36 1.2725
∞ 0.006 75 1.3060 0.003 73 1.2927 0.002 78 1.2865 0.001 88 1.2786 0.001 42 1.2733
items observed (m = 2). Control limits can be calculated from equations (21.10) and
(21.11) with φ m based on the required ARL 0 from equation (21.12). The adjustment
can be obtained from (21.4).
factor γ φ m
fordifferent
Table21.2givesthevaluesofφ m andtherespectiveadjustmentfactorγ φ m
values of m ranging from 2 to 100 and ARL 0 = 200, 370, 500, 750, 1000. The last row of
the table (m =∞) is the value when p 0 is given, which is φ from Table 21.1. Similarly,
5
Tang and Cheong noted that when p is estimated sequentially, it has no effect on φ m ,
and φ m converges to that of the known value chart as m increases.
To start using the CCC chart without undue delay, it was recommended by Tang
5
and Cheong that p 0 be estimated using m = 2 and be sequentially updated as long
as the process is deemed to be in control. Two associated problems are that the ARL
performance in detecting process shift is poor for small m, and that excessive updat-
ing increases the risk of including data from processes with drift. To mitigate these
problems, we propose a two-pronged approach. First, a target ARL performance for a
given change in p is specified, so that the updating is terminated at a particular m; and
more stringent criteria are used to decide whether updating should be suspended.
21.4.1.1 Termination of sequential updating
For a given change in p, which can be indexed by ρ = p/p 0 , define R s as the ratio
between a desired ARL, ARL m , and the ARL with known parameter ARL ∞ . In other
words,
ARL m
R s = , (21.19)
ARL ∞