
Page 345 - Six Sigma Advanced Tools for Black Belts and Master Black Belts
P. 345
OTE/SPH
OTE/SPH
3:7
August 31, 2006
Char Count= 0
JWBK119-21
330 Establishing Cumulative Conformance Count Charts
400.0
350.0
300.0
250.0
ARL 200.0
150.0
100.0 n = 10000 n = 20000
n = 50000 n = 100000
50.0
Known p
00
0.000 0.500 1.000 1.500 2.000 2.500
p = p/p 0
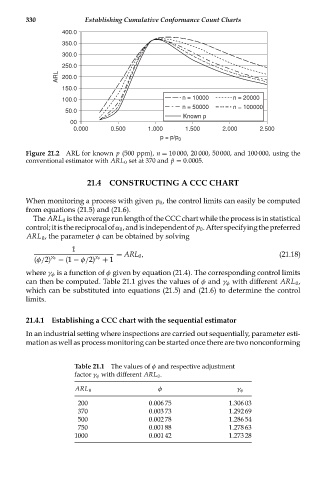
Figure 21.2 ARL for known p (500 ppm), n = 10 000, 20 000, 50 000, and 100 000, using the
conventional estimator with ARL 0 set at 370 and ˆp = 0.0005.
21.4 CONSTRUCTING A CCC CHART
When monitoring a process with given p 0 , the control limits can easily be computed
from equations (21.5) and (21.6).
The ARL 0 is the average run length of the CCC chart while the process is in statistical
control;itisthereciprocalofα 0 ,andisindependentof p 0 .Afterspecifyingthepreferred
ARL 0 , the parameter φ can be obtained by solving
1
= ARL 0 , (21.18)
γ φ
γ φ
(φ/2) − (1 − φ/2) + 1
where γ φ is a function of φ given by equation (21.4). The corresponding control limits
can then be computed. Table 21.1 gives the values of φ and γ φ with different ARL 0 ,
which can be substituted into equations (21.5) and (21.6) to determine the control
limits.
21.4.1 Establishing a CCC chart with the sequential estimator
In an industrial setting where inspections are carried out sequentially, parameter esti-
mation as well as process monitoring can be started once there are two nonconforming
Table 21.1 The values of φ and respective adjustment
factor γ φ with different ARL 0 .
ARL 0 φ γ φ
200 0.006 75 1.306 03
370 0.003 73 1.292 69
500 0.002 78 1.286 54
750 0.001 88 1.278 63
1000 0.001 42 1.273 28