
Page 419 - Six Sigma Advanced Tools for Black Belts and Master Black Belts
P. 419
OTE/SPH
OTE/SPH
Char Count= 0
3:9
JWBK119-25
August 31, 2006
404 CUSUM and Backward CUSUM for Autocorrelated Observations
CUSUM
50
40
30
20
10
0
−10
−20
0 10 20 30 40 50 60
TIME (t)
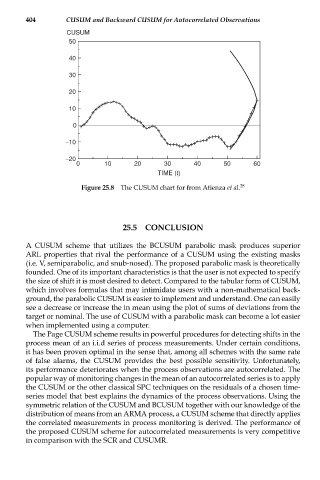
Figure 25.8 The CUSUM chart for from Atienza et al. 28
25.5 CONCLUSION
A CUSUM scheme that utilizes the BCUSUM parabolic mask produces superior
ARL properties that rival the performance of a CUSUM using the existing masks
(i.e. V, semiparabolic, and snub-nosed). The proposed parabolic mask is theoretically
founded. One of its important characteristics is that the user is not expected to specify
the size of shift it is most desired to detect. Compared to the tabular form of CUSUM,
which involves formulas that may intimidate users with a non-mathematical back-
ground, the parabolic CUSUM is easier to implement and understand. One can easily
see a decrease or increase the in mean using the plot of sums of deviations from the
target or nominal. The use of CUSUM with a parabolic mask can become a lot easier
when implemented using a computer.
The Page CUSUM scheme results in powerful procedures for detecting shifts in the
process mean of an i.i.d series of process measurements. Under certain conditions,
it has been proven optimal in the sense that, among all schemes with the same rate
of false alarms, the CUSUM provides the best possible sensitivity. Unfortunately,
its performance deteriorates when the process observations are autocorrelated. The
popular way of monitoring changes in the mean of an autocorrelated series is to apply
the CUSUM or the other classical SPC techniques on the residuals of a chosen time-
series model that best explains the dynamics of the process observations. Using the
symmetric relation of the CUSUM and BCUSUM together with our knowledge of the
distribution of means from an ARMA process, a CUSUM scheme that directly applies
the correlated measurements in process monitoring is derived. The performance of
the proposed CUSUM scheme for autocorrelated measurements is very competitive
in comparison with the SCR and CUSUMR.