
Page 216 - Department of Social Development Annual Report 2021
P. 216
PART D: HUMAN RESOURCE MANAGEMENT
HUMAN RESOURCE OVERSIGHT STATISTICS
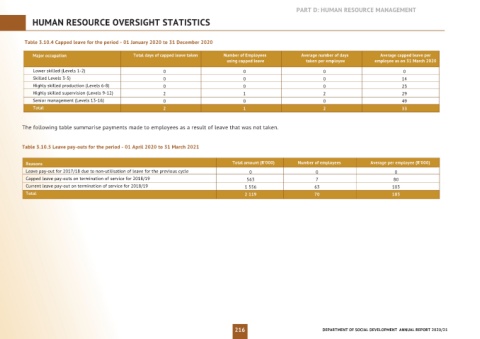
Table 3.10.4 Capped leave for the period - 01 January 2020 to 31 December 2020
Major occupation Total days of capped leave taken Number of Employees Average number of days Average capped leave per
using capped leave taken per employee employee as on 31 March 2020
Lower skilled (Levels 1-2) 0 0 0 0
Skilled Levels 3-5) 0 0 0 14
Highly skilled production (Levels 6-8) 0 0 0 23
Highly skilled supervision (Levels 9-12) 2 1 2 29
Senior management (Levels 13-16) 0 0 0 49
Total 2 1 2 33
The following table summarise payments made to employees as a result of leave that was not taken.
Table 3.10.5 Leave pay-outs for the period - 01 April 2020 to 31 March 2021
Reasons Total amount (R’000) Number of employees Average per employee (R’000)
Leave pay-out for 2017/18 due to non-utilisation of leave for the previous cycle 0 0 0
Capped leave pay-outs on termination of service for 2018/19 563 7 80
Current leave pay-out on termination of service for 2018/19 1 556 63 103
Total 2 119 70 183
216 DEPARTMENT OF SOCIAL DEVELOPMENT ANNUAL REPORT 2020/21