
Page 15 - PR Communication Age January-June2020
P. 15
Data Analysis & Interpretation the exact age interval does not need to be same in both
cases. As we have more data on 18-22 age group & males,
Demographic Data absolute data when comparing them with others would not
The following table represents the age and gender of the be the best solution.
participants filling the survey.
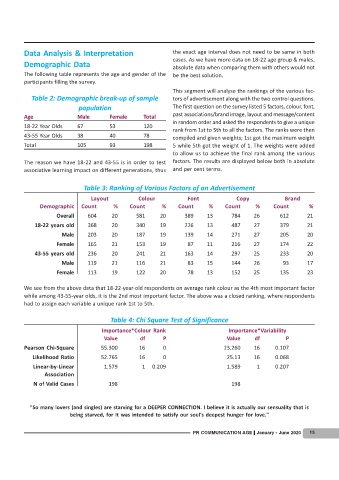
This segment will analyse the rankings of the various fac-
Table 2: Demographic break-up of sample tors of advertisement along with the two control questions.
population The first question on the survey listed 5 factors, colour, font,
Age Male Female Total past associations/brand image, layout and message/content
in random order and asked the respondents to give a unique
18-22 Year Olds 67 53 120
rank from 1st to 5th to all the factors. The ranks were then
43-55 Year Olds 38 40 78 compiled and given weights; 1st got the maximum weight
Total 105 93 198 5 while 5th got the weight of 1. The weights were added
to allow us to achieve the final rank among the various
The reason we have 18-22 and 43-55 is in order to test factors. The results are displayed below both in absolute
associative learning impact on different generations, thus and per cent terms.
Table 3: Ranking of Various Factors of an Advertisement
Layout Colour Font Copy Brand
Demographic Count % Count % Count % Count % Count %
Overall 604 20 581 20 389 13 784 26 612 21
18-22 years old 368 20 340 19 226 13 487 27 379 21
Male 203 20 187 19 139 14 271 27 205 20
Female 165 21 153 19 87 11 216 27 174 22
43-55 years old 236 20 241 21 163 14 297 25 233 20
Male 119 21 116 21 83 15 144 26 93 17
Female 113 19 122 20 78 13 152 25 135 23
We see from the above data that 18-22-year-old respondents on average rank colour as the 4th most important factor
while among 43-55-year olds, it is the 2nd most important factor. The above was a closed ranking, where respondents
had to assign each variable a unique rank 1st to 5th.
Table 4: Chi Square Test of Significance
Importance*Colour Rank Importance*Variability
Value df P Value df P
Pearson Chi-Square 55.300 16 0 23.260 16 0.107
Likelihood Ratio 52.765 16 0 25.13 16 0.068
Linear-by-Linear 1.579 1 0.209 1.589 1 0.207
Association
N of Valid Cases 198 198
"So many lovers (and singles) are starving for a DEEPER CONNECTION. I believe it is actually our sensuality that is
being starved, for it was intended to satisfy our soul's deepest hunger for love."
PR COMMUNICATION AGE January - June 2020 15