
Page 31 - The Insurance Times September 2024
P. 31
expectancy at birth for males in India is 68.2 and for females fertility to low mortality/low fertility in a country. In India we
it is 70.7. Life expectancy for females is thus higher by 2.5 are witnessing population aging due to increased longetivity,
years than males. decreased mortality rate and decreased fertility rate.
Elderly Population in India : The number of people aged Besides aging one of the major concern for India, is the
60 years and above were 149 million in 2022 (as on 1 July), growth of the elderly population. The growth of the elderly
which is about 10.5 percent of the total population of the population is much faster than the growth of the total
country. It is expected that by 2050, the share of older population of the country. During the period 2000 to 2022,
persons will double to 20.8 percent, with the absolute the growth of the total population has been 34% but the
number at 347 million. growth of 60+ and 80+ population has been 128% and 134%
respectively for the same duration.
Life expectancy at the age of 60 : Based on the sex- and
age specific death rates prevailing at the time, it is the Key Population Indicators 2024
average number of years that a person of 60 years of age
could be expected to live. In India life expectancy at 60 years Population aged 158,939
is 18.5 years which means that a person at 60 years, may 60+ (thousands)
expect to live another 18.3 years. This life expectancy in case
Population aged 60+ (% of total population) 11
of females is 19 years as compared to males at 17.5 years. Percentage of women out of the population 51.6
The elderly women thus survive for longer duration as
aged 60+
compared to males at the age of 60 years.
Percentage of women out of the population 57.4
Decreased fertility rate and less aged 80+
population in the age bracket of 0-14
The above population indicators by age groups clearly
years suggest the feminisation of Indian elderly population as the
A major factor contributing to demographic transition in percentage of female population aged 60+ and 80+ is 51.6%
India is the decline in the fertility rate. India has witnessed and 57.4% of the total population.
a substantial decline in the fertility rate. There is a decrease
of -65.41% in total population fertility rate from 5.7316 in The shape of the population pyramid of India is gradually
1950's to 1.9823 in 2024 births per woman. This downward changing from a wide base/narrow top to a barrel-shaped
trend in fertility rate is predicted to further decrease in the form. It is evident that in India there are more men than
future from 1.9823 to an average of 1.6907 children born women of all ages until about 64 years and there are more
per woman i.e an additional decrease of -14.71% from 2024 women in the population than men at above 64 years of
to 2100. age. Thus, there is a feminization of Indian elderly
population.
Population aging and Feminisation of
India's elderly population Major problems of elderly female
Population aging results due to shift from high mortality/high population
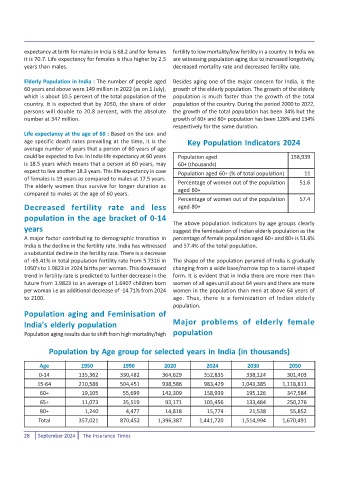
Population by Age group for selected years in India (in thousands)
Age 1950 1990 2020 2024 2030 2050
0-14 135,362 330,482 364,629 352,835 338,124 301,403
15-64 210,586 504,451 938,586 983,429 1,043,385 1,118,811
60+ 19,105 55,699 142,309 158,939 195,126 347,584
65+ 11,073 35,519 93,171 105,456 133,484 250,276
80+ 1,240 4,477 14,818 15,774 21,538 55,852
Total 357,021 870,452 1,396,387 1,441,720 1,514,994 1,670,491
28 September 2024 The Insurance Times