
Page 146 - H:\Annual Report\
P. 146
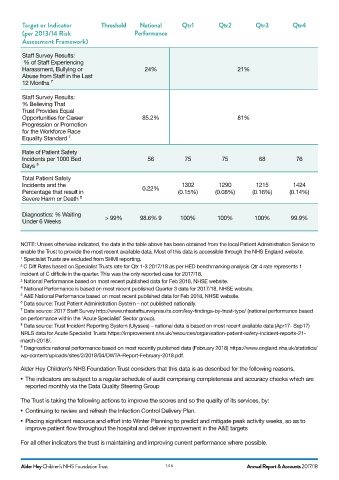
Target or Indicator         Threshold    National       Qtr1         Qtr2         Qtr3         Qtr4
         (per 2013/14 Risk                      Performance
         Assessment Framework)


         Staff Survey Results:
          % of Staff Experiencing
         Harassment, Bullying or                    24%                             21%
         Abuse from Staff in the Last
         12 Months ⁷

         Staff Survey Results:
         % Believing That
         Trust Provides Equal
         Opportunities for Career                  85.2%                            81%
         Progression or Promotion
         for the Workforce Race
         Equality Standard ⁷

         Rate of Patient Safety
         Incidents per 1000 Bed                      56           75           75           68           76
         Days ⁸

         Total Patient Safety
         Incidents and the                                       1302         1290         1215         1424
                                                   0.22%
         Percentage that result in                              (0.15%)      (0.08%)      (0.16%)      (0.14%)
         Severe Harm or Death ⁸


         Diagnostics: % Waiting
                                      > 99%       98.6% 9       100%         100%         100%         99.9%
         Under 6 Weeks


        NOTE: Unless otherwise indicated, the data in the table above has been obtained from the local Patient Administration Service to
        enable the Trust to provide the most recent available data. Most of this data is accessible through the NHS England website.
        ¹ Specialist Trusts are excluded from SHMI reporting.
        ² C Diff Rates based on Specialist Trusts rate for Qtr 1-3 2017/18 as per HED benchmarking analysis Qtr 4 rate represents 1
        incident of C difficile in the quarter. This was the only reported case for 2017/18.
        ³ National Performance based on most recent published data for Feb 2018, NHSE website.
        ₄
          National Performance is based on most recent published Quarter 3 data for 2017/18, NHSE website.
        ⁵ A&E National Performance based on most recent published data for Feb 2018, NHSE website.
        ⁶ Data source: Trust Patient Administration System – not published nationally.
        ⁷ Data source: 2017 Staff Survey http://www.nhsstaffsurveyresults.com/key-findings-by-trust-type/ (national performance based
        on performance within the ‘Acute Specialist’ Sector group).
        ⁸ Data source: Trust Incident Reporting System (Ulysses) – national data is based on most recent available data (Apr17- Sep17)
        NRLS data for Acute Specialist Trusts https://improvement.nhs.uk/resources/organisation-patient-safety-incident-reports-21-
        march-2018/.
        ⁹ Diagnostics national performance based on most recently published data (February 2018) https://www.england.nhs.uk/statistics/
        wp-content/uploads/sites/2/2018/04/DWTA-Report-February-2018.pdf.
        Alder Hey Children’s NHS Foundation Trust considers that this data is as described for the following reasons.

        • The indicators are subject to a regular schedule of audit comprising completeness and accuracy checks which are
          reported monthly via the Data Quality Steering Group

        The Trust is taking the following actions to improve the scores and so the quality of its services, by:

        • Continuing to review and refresh the Infection Control Delivery Plan.
        • Placing significant resource and effort into Winter Planning to predict and mitigate peak activity weeks, so as to
          improve patient flow throughout the hospital and deliver improvement in the A&E targets

        For all other indicators the trust is maintaining and improving current performance where possible.


        Alder Hey Children’s NHS Foundation Trust          146                          Annual Report & Accounts 2017/18