
Page 653 - Atlas of Histology with Functional Correlations
P. 653
Mallory-Azan. ×100.
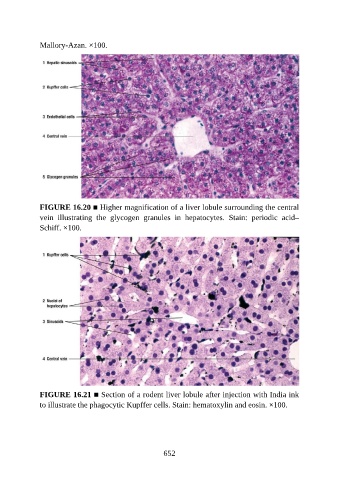
FIGURE 16.20 ■ Higher magnification of a liver lobule surrounding the central
vein illustrating the glycogen granules in hepatocytes. Stain: periodic acid–
Schiff. ×100.
FIGURE 16.21 ■ Section of a rodent liver lobule after injection with India ink
to illustrate the phagocytic Kupffer cells. Stain: hematoxylin and eosin. ×100.
652