
Page 437 - Maxwell House
P. 437
MORE COMPLICATED ELEMENTS OF FEED LINES 417
of minimum phase system, i.e. their transfer function zeros and poles are strictly inside the left
half of complex frequency plane. Loosely speaking, it should be the only one path for signals in
such filters from the filter input to its output, i.e. theoretically there is no cross coupling or any
intended or unintended feedback between filter elements. More precisely, the complex transfer
function of the filter must satisfy Kramers-Kronig (K-K) relations established in Section 2.10.1
of Chapter 2 meaning that the expression (2.111) should be fulfilled. If so, on the first stage of
filter synthesis we need to approximate its transfer function with proper polynomial or rational
function [8, 12] with appropriate location of zeros and poles. Then the filter phase characteristic
becomes known analytically or could be estimated with the help of the second expression in
(2.111). Note that the cross coupling is not an evil effect at all. Its proper implementation might
not only greater improve the filter characteristics but reduce their size and mass thereby
widening their application [13 – 15]. However, the synthesis procedure and following built-up
becomes more complicated and costly.
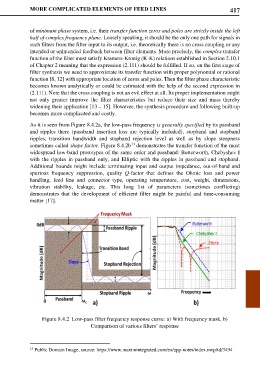
As it is seen from Figure 8.4.2a, the low-pass frequency is generally specified by its passband
and ripples there (passband insertion loss are typically included), stopband and stopband
ripples, transition bandwidth and stopband rejection level as well as by slope steepness
13
sometimes called shape factor. Figure 8.4.2b demonstrates the transfer function of the most
widespread low-band prototypes of the same order and passband: Butterworth, Chebyshev I
with the ripples in passband only, and Elliptic with the ripples in passband and stopband.
Additional bounds might include terminating input and output impedance, out-of-band and
spurious frequency suppression, quality Q-factor that defines the Ohmic loss and power
handling, feed line and connector type, operating temperature, cost, weight, dimensions,
vibration stability, leakage, etc. This long list of parameters (sometimes conflicting)
demonstrates that the development of efficient filter might be painful and time-consuming
matter [17].
Figure 8.4.2 Low-pass filter frequency response curve: a) With frequency mask, b)
Comparison of various filters’ response
13 Public Domain Image, source: https://www.maximintegrated.com/en/app-notes/index.mvp/id/3494