
Page 872 - Mechatronics with Experiments
P. 872
858 MECHATRONICS
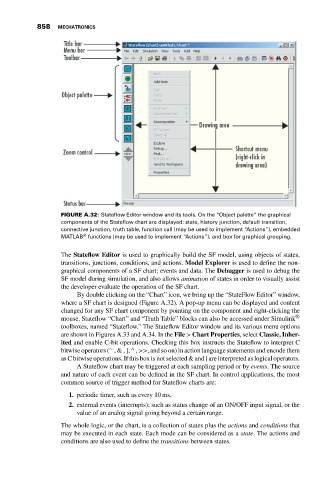
FIGURE A.32: Stateflow Editor window and its tools. On the “Object palette” the graphical
components of the Stateflow chart are displayed: state, history junction, default transition,
connective junction, truth table, function call (may be used to implement “Actions”), embedded
®
MATLAB functions (may be used to implement “Actions”), and box for graphical grouping.
The Stateflow Editor is used to graphically build the SF model, using objects of states,
transitions, junctions, conditions, and actions. Model Explorer is used to define the non-
graphical components of a SF chart; events and data. The Debugger is used to debug the
SF model during simulation, and also allows animation of states in order to visually assist
the developer evaluate the operation of the SF chart.
By double clicking on the “Chart” icon, we bring up the “StateFlow Editor” window,
where a SF chart is designed (Figure A.32). A pop-up menu can be displayed and content
changed for any SF chart component by pointing on the component and right-clicking the
mouse. Stateflow “Chart” and “Truth Table” blocks can also be accessed under Simulink ®
toolboxes, named “Stateflow.” The Stateflow Editor window and its various menu options
are shown in Figures A.33 and A.34. In the File > Chart Properties, select Classic, Inher-
ited and enable C-bit operations. Checking this box instructs the Stateflow to interpret C
∧
∼
bitwise operators ( ,&, |, , >>, and so on) in action language statements and encode them
as C bitwise operations. If this box is not selected & and | are interpreted as logical operators.
A Stateflow chart may be triggered at each sampling period or by events. The source
and nature of each event can be defined in the SF chart. In control applications, the most
common source of trigger method for Stateflow charts are:
1. periodic timer, such as every 10 ms,
2. external events (interrupts); such as status change of an ON/OFF input signal, or the
value of an analog signal going beyond a certain range.
The whole logic, or the chart, is a collection of states plus the actions and conditions that
may be executed in each state. Each mode can be considered as a state. The actions and
conditions are also used to define the transitions between states.