Page 450 - Most-Essential-Learning-Competencies-Matrix-LATEST-EDITION-FROM-BCD
P. 450

450

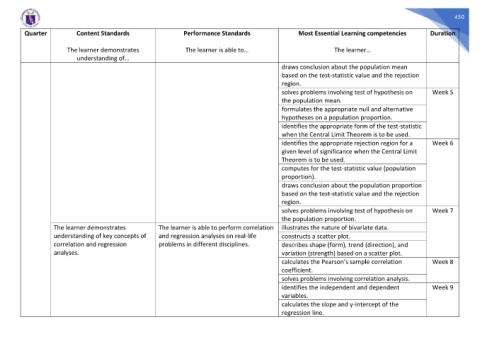
          Quarter           Content Standards                    Performance Standards                    Most Essential Learning competencies          Duration

                         The learner demonstrates                 The learner is able to…                             The learner…
                            understanding of…
                                                                                                    draws conclusion about the population mean
                                                                                                    based on the test-statistic value and the rejection
                                                                                                    region.
                                                                                                    solves problems involving test of hypothesis on      Week 5
                                                                                                    the population mean.
                                                                                                    formulates the appropriate null and alternative
                                                                                                    hypotheses on a population proportion.
                                                                                                    identifies the appropriate form of the test-statistic
                                                                                                    when the Central Limit Theorem is to be used.
                                                                                                    identifies the appropriate rejection region for a    Week 6
                                                                                                    given level of significance when the Central Limit
                                                                                                    Theorem is to be used.
                                                                                                    computes for the test-statistic value (population
                                                                                                    proportion).
                                                                                                    draws conclusion about the population proportion
                                                                                                    based on the test-statistic value and the rejection
                                                                                                    region.
                                                                                                    solves problems involving test of hypothesis on      Week 7
                                                                                                    the population proportion.
                    The learner demonstrates             The learner is able to perform correlation  illustrates the nature of bivariate data.
                    understanding of key concepts of     and regression analyses on real-life       constructs a scatter plot.
                    correlation and regression           problems in different disciplines.         describes shape (form), trend (direction), and
                    analyses.                                                                       variation (strength) based on a scatter plot.
                                                                                                    calculates the Pearson’s sample correlation          Week 8
                                                                                                    coefficient.
                                                                                                    solves problems involving correlation analysis.
                                                                                                    identifies the independent and dependent             Week 9
                                                                                                    variables.
                                                                                                    calculates the slope and y-intercept of the
                                                                                                    regression line.
   445   446   447   448   449   450   451   452   453   454   455