Page 488 - Most-Essential-Learning-Competencies-Matrix-LATEST-EDITION-FROM-BCD
P. 488

488

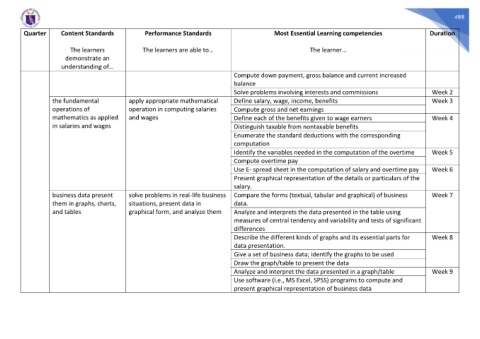
         Quarter      Content Standards             Performance Standards                        Most Essential Learning competencies                   Duration

                          The learners             The learners are able to…                                  The learner…
                        demonstrate an
                       understanding of…
                                                                                   Compute down payment, gross balance and current increased
                                                                                   balance
                                                                                   Solve problems involving interests and commissions                    Week 2
                   the fundamental            apply appropriate mathematical       Define salary, wage, income, benefits                                 Week 3
                   operations of              operation in computing salaries      Compute gross and net earnings
                   mathematics as applied     and wages                            Define each of the benefits given to wage earners                     Week 4
                   in salaries and wages                                           Distinguish taxable from nontaxable benefits
                                                                                   Enumerate the standard deductions with the corresponding
                                                                                   computation
                                                                                   Identify the variables needed in the computation of the overtime      Week 5
                                                                                   Compute overtime pay
                                                                                   Use E- spread sheet in the computation of salary and overtime pay     Week 6
                                                                                   Present graphical representation of the details or particulars of the
                                                                                   salary.
                   business data present      solve problems in real-life business  Compare the forms (textual, tabular and graphical) of business       Week 7
                   them in graphs, charts,    situations, present data in          data.
                   and tables                 graphical form, and analyze them     Analyze and interprets the data presented in the table using
                                                                                   measures of central tendency and variability and tests of significant
                                                                                   differences
                                                                                   Describe the different kinds of graphs and its essential parts for    Week 8
                                                                                   data presentation.
                                                                                   Give a set of business data; identify the graphs to be used
                                                                                   Draw the graph/table to present the data
                                                                                   Analyze and interpret the data presented in a graph/table             Week 9
                                                                                   Use software (i.e., MS Excel, SPSS) programs to compute and
                                                                                   present graphical representation of business data
   483   484   485   486   487   488   489   490   491   492   493