
Page 19 - SKM 2019 TRIANI
P. 19
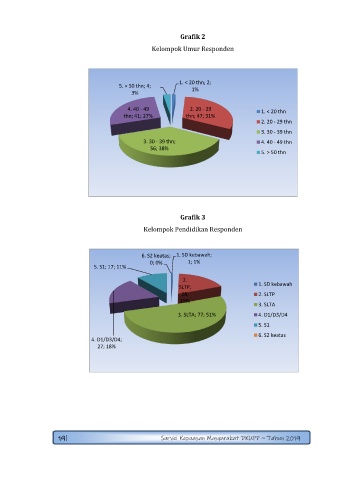
Grafik 2

                                                      Kelompok Umur Responden


                                                                1. < 20 thn; 2;
                                           5. > 50 thn; 4;          1%
                                               3%

                                              4. 40 - 49            2. 20 - 29               1. < 20 thn
                                            thn; 41; 27%          thn; 47; 31%
                                                                                             2. 20 - 29 thn
                                                                                             3. 30 - 39 thn
                                                   3. 30 - 39 thn;                           4. 40 - 49 thn
                                                      56; 38%
                                                                                             5. > 50 thn


                                                                Grafik 3
                                                   Kelompok Pendidikan Responden


                                                   6. S2 keatas;   1. SD kebawah;
                                                      0; 0%        1; 1%
                                  5. S1; 17; 11%

                                                                 2.
                                                                                            1. SD kebawah
                                                                SLTP;
                                                                 28;                        2. SLTP
                                                                19%
                                                                                            3. SLTA
                                                                3. SLTA; 77; 51%            4. D1/D3/D4

                                                                                            5. S1
                                                                                            6. S2 keatas
                                 4. D1/D3/D4;
                                   27; 18%


                      19|                                 Survei Kepuasan Masyarakat DKUPP ~ Tahun 2019