
Page 73 - Condition Monitor User Manual
P. 73
Configuring a Monitor
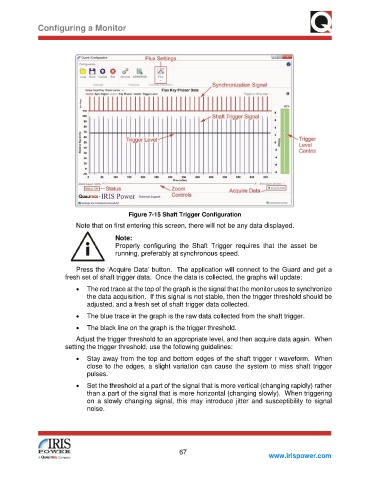
Figure 7-15 Shaft Trigger Configuration
Note that on first entering this screen, there will not be any data displayed.
Note:
Properly configuring the Shaft Trigger requires that the asset be
running, preferably at synchronous speed.
Press the ‘Acquire Data’ button. The application will connect to the Guard and get a
fresh set of shaft trigger data. Once the data is collected, the graphs will update:
• The red trace at the top of the graph is the signal that the monitor uses to synchronize
the data acquisition. If this signal is not stable, then the trigger threshold should be
adjusted, and a fresh set of shaft trigger data collected.
• The blue trace in the graph is the raw data collected from the shaft trigger.
• The black line on the graph is the trigger threshold.
Adjust the trigger threshold to an appropriate level, and then acquire data again. When
setting the trigger threshold, use the following guidelines:
• Stay away from the top and bottom edges of the shaft trigger r waveform. When
close to the edges, a slight variation can cause the system to miss shaft trigger
pulses.
• Set the threshold at a part of the signal that is more vertical (changing rapidly) rather
than a part of the signal that is more horizontal (changing slowly). When triggering
on a slowly changing signal, this may introduce jitter and susceptibility to signal
noise.
67
www.irispower.com