
Page 17 - Instrumental Analysis - Pharm D Clinical- 07-PA403
P. 17
UV-visible Spectrophotometry
Relation between ε and A(1%, 1 cm)
A(1%, 1 cm) 1 g/100 mL
ε MW/1000 mL
ε x 1 g/100 mL = A(1%, 1 cm) x MW/1000mL
A(1%, 1 cm) x MW
ε = ──────────────
10
29
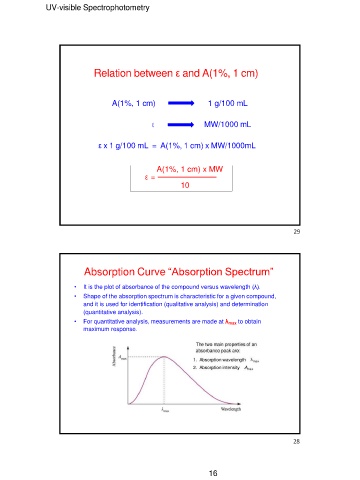
Absorption Curve “Absorption Spectrum”
• It is the plot of absorbance of the compound versus wavelength (λ).
• Shape of the absorption spectrum is characteristic for a given compound,
and it is used for identification (qualitative analysis) and determination
(quantitative analysis).
• For quantitative analysis, measurements are made at λmax to obtain
maximum response.
28
16