
Page 105 - Theoretical and Practical Interpretation of Investment Attractiveness
P. 105
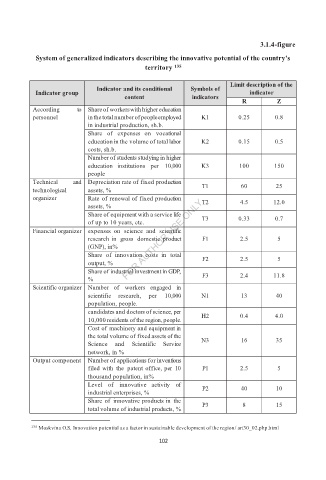
3.1.4-figure
          System of generalized indicators describing the innovative potential of the country's
                                       territory  135

                                                             Limit description of the
                          Indicator and its conditional   Symbols of
          Indicator group                                         indicator
                                 content           indicators
                                                                R        Z
          According  to  Share of workers with higher education
          personnel     in the total number of people employed   K1  0.25  0.8
                        in industrial production, sh.b.
                        Share of  expenses  on vocational
                        education in the volume of total labor   K2  0.15  0.5
                        costs, sh.b.
                        Number of students studying in higher
                        education institutions  per  10,000   K3  100   150
                        people
          Technical  and  Depreciation rate of fixed production
                                                      T1        60       25
          technological   assets, %
          organizer     Rate of renewal of fixed production
                                                      T2        4.5     12.0
                        assets, %
                        Share of equipment with a service life
                                                      T3       0.33      0.7
                        of up to 10 years, etc.
          Financial organizer  expenses  on science  and scientific
                        research in  gross  domestic product   F1  2.5   5
                        (GNP), in%
                        Share  of innovation costs in  total
                                                      F2        2.5      5
                        output, %
                        Share of industrial investment in GDP,
                                                      F3        2.4     11.8
                        %
          Scientific organizer  Number of  workers engaged  in
                        scientific research,  per   10,000   N1  13      40
                        population, people.
                        candidates and doctors of science, per
                                                      H2        0.4      4.0
                        10,000 residents of the region, people.
                        Cost of machinery and equipment in
                        the total volume of fixed assets of the   N3  16  35
                        Science and Scientific  Service
                        network, in %
          Output component  Number of applications for inventions
                        filed with  the  patent office, per  10   P1  2.5  5
                        thousand population, in%
                        Level of innovative  activity of   P2   40       10
                        industrial enterprises, %
                        Share of  innovative products in  the
                                                      P3        8        15
                        total volume of industrial products, %

         135   Moskvina O.S. Innovation potential as a factor in sustainable development of the region/ art30_02.php.html

                                          102