
Page 100 - Theoretical and Practical Interpretation of Investment Attractiveness
P. 100
The fifth stage is the interpretation of the results of the highest (regions provided with
financial and intellectual resources: development potential, diversified and favorable
ecological environment) and the lowest stability 129 .
1. Analyzing the scientific sources related to this field, it is possible to note the first
group, that is, the scientific researches carried out by a number of scientists in the evaluation
of the socio-economic potential of the regions through average arithmetic methods. The
calculations proposed by them were carried out in three stages:
2. The amount of basic indicators of the comprehensive assessment of the level of the
area's potential. This group of indicators includes GDP, the volume of fixed capital
investments per capita, the share of the average workforce employed in private enterprises,
etc. (11 indicators in total);
3. Indicator of development potential of social infrastructure networks: cumulative
indicator of development of social networks, mined minerals per capita; reproduction per
capita; houses put into use per capita, polluted wastewater released into the environment per
capita.
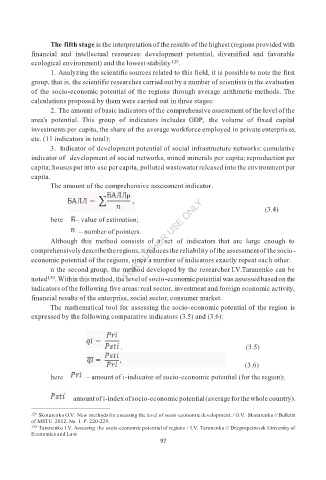
The amount of the comprehensive assessment indicator.
(3.4)
here – value of estimation;
– number of pointers.
Although this method consists of a set of indicators that are large enough to
comprehensively describe the regions, it reduces the reliability of the assessment of the socio-
economic potential of the regions, since a number of indicators exactly repeat each other.
n the second group, the method developed by the researcher I.V.Taranenko can be
noted 130 . Within this method, the level of socio-economic potential was assessed based on the
indicators of the following five areas: real sector, investment and foreign economic activity,
financial results of the enterprise, social sector, consumer market.
The mathematical tool for assessing the socio-economic potential of the region is
expressed by the following comparative indicators (3.5) and (3.6):
, (3.5)
(3.6)
here – amount of i-indicator of socio-economic potential (for the region);
– amount of i-index of socio-economic potential (average for the whole country).
129 Skotarenko O.V. New methods for assessing the level of socio-economic development. / O.V. Skotarenko // Bulletin
of MSTU. 2012. No. 1. P. 220-229.
130 Taranenko I.V. Assessing the socio-economic potential of regions / I.V. Taranenko // Dnepropetrovsk University of
Economics and Law.
97